Polyethylene terephthalate (PET) is a plastic commonly used to make beverage bottles. PET is hygroscopic [1, 2]. Therefore, if you have a bottle of Sprite, you would expect the water to be absorbed by the plastic, diffuse through the bottle, then evaporate outside the bottle.
And that’s exactly what happens.
In the picture below are two bottles of Sprite in PET bottles. On the left, a partially-consumed 591 mL bottle, unopened for the last 9 years (2009). On the right, a fresh unopened 710 mL bottle (2018). As can be seen, the old bottle has been squished, as water has escaped but no air has entered to replace the lost water. How much water was lost? I’m going to find out…
(Spoiler: 28% water loss in 9 years.)
Methodology
If a substantial amount of water (but not sugar) has left the bottle, then the sugar concentration in the bottle should have increased. If I assume that the Sprite formula is the same for both bottles, then I can calculate the amount of water that left the bottle by comparing the sugar concentrations between the old and new bottles.
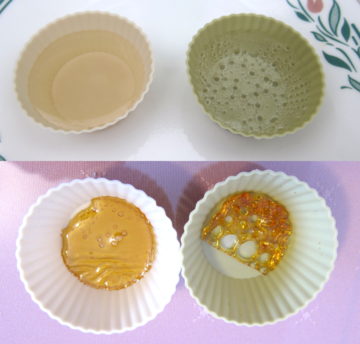
The methodology is fairly simple: Take a sample of Sprite and weight it, bake it until mostly dry, then weigh the amount of unevaporated solids (sugar) remaining. The old Sprite should have a higher fraction of solids because water was lost.
The Sprite was baked at around 150°C until nearly dry, then at around 90°C for an hour more. The intent is to dry the sugar without too much caramelization.
Sprite formula appears to be unchanged


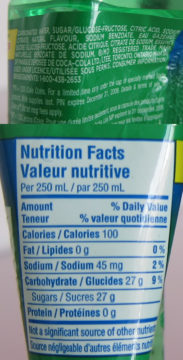
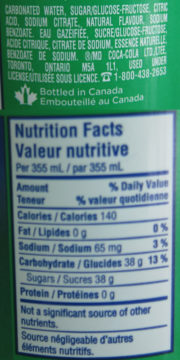
Comparing the ingredients and nutrition facts from the labels of the 2009 and 2018 Sprite bottles suggests that my assumption that the formula has not significantly changed is likely true.
Results

| 2009 | 2018 | |
|---|---|---|
| Sample weight (grams) | 14.63 | 14.52 |
| Solids remaining after bake (grams) | 2.04 | 1.51 |
| Solids fraction | 13.9% | 10.4% |
| Water : solids ratio | 6.17 | 8.62 |
| Fraction of water lost | 28.3% |
Table 1 above shows the weights of the Sprite samples before and after baking. The old Sprite has a higher concentration of solids remaining after baking. If we assume that the sugar concentration at manufacture was the same for both samples, then about 28% of the water (or about 100 mL) was lost in 9 years.
Also interesting is that my measured solids concentration for the fresh bottle (10.4% by mass) agrees quite well with the Nutrition Facts label (38g carbohydrates in 355 mL of Sprite with a density of around 1.04 g/mL [3] results in a sugar concentration of about 10.3%)
Conclusions
In a PET bottle of Sprite, about 28% (~100 mL) of the water diffused through the bottle over 9 years.
First, I followed a dude’s link in a blog on CPU bottlenecks to one of your blogposts, to check out in-flight branch limits
(https://travisdowns.github.io/blog/2019/06/11/speed-limits.html)
only to discover fascinating Sprite research :>
Did you keep the bottle intentionally? Or found behind a couch?
You have a typo here:
If I assume that the Sprite formula is the same for both bottles, THEN
It was semi-intentional… It was left on my desk, so I decided to keep it untouched. I’ve already seen this before in a water bottle (18 years so far), but didn’t have the foresight to measure how much water was originally in that bottle before it started evaporating.
I’m confused: I still can’t see where the typo is…
The percentages don’t add up.
For the 2018 bottle 38g in 355ml/g of water is 10.7% and less than 13%.
For the 2009 bottle 27g in 250ml/g of water is 10.8% and more than 9%.
Perhaps marketing department can’t do basic maths?
The percentages on nutrition labels are percentages of a recommended daily diet, not the concentrations in the product itself.
The recommended diet seems to be about 300g of carbohydrates per day:
38g is ~13% of 300g
27g is 9% of 300g