So I got myself a new Core i7-3770K, using the stock heatsink/fan, and a motherboard that doesn’t have VCore adjustments. Therefore, not much overclocking, unfortunately.
I will run the workloads that I ran on various older systems and compare them with the new processor. Since I don’t have a Sandy Bridge processor, the comparisons will be against the previous microarchitecture (Lynnfield/Gulftown). I expect Sandy Bridge would be very similar to (but slightly slower) than Ivy Bridge.
See also:
FPGA CAD
The first set of benchmarks are an extension of the earlier FPGA CAD benchmarks. Most of the results have already been presented there, but will be copied here for convenience.
Hardware
| System | CPU | Memory |
|---|---|---|
| Pentium 4 2800 | 130 nm Pentium 4 2.8 GHz (Northwood) | 2-channel DDR-400, Intel 875P |
| Xeon 3000 | 65 nm (Core 2) Xeon 5160 x 2 (Woodcrest) | 4-channel DDR2 FB-DIMM, Intel 5000X |
| C2Q 2660 | 65 nm Core 2 Quad Q6700 (Kentsfield) | 2-channel DDR2, Intel Q35 |
| C2Q 3500 | 45 nm Core 2 Quad Q9550 (Yorkfield) | 2-channel DDR2-824 4-4-4-12, Intel P965 |
| i7 3300 | 45 nm Core i7-860 (Lynnfield) | 2-channel DDR3-1580 9-9-9-24, Intel P55 |
| i7 4215 | 32 nm Core i7-980X (Gulftown) | 3-channel DDR3-1690 |
| IVB 4300 | 22 nm Core i7-3770K (Ivy Bridge) | 2-channel DDR3-1600 9-9-8-24-1T, Intel Z77 |
Workloads
| Test | Description |
|---|---|
| Memory Latency 128M | Read latency while randomly accessing a 128 MB array, using 4 KB pages. Includes the impact of TLB misses. |
| Memory Bandwidth | STREAM benchmark, copy bandwidth. Compiled with 64-bit gcc 4.4.3 |
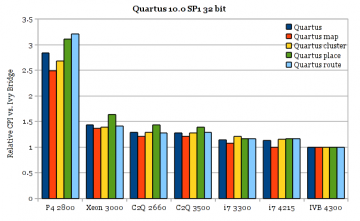
| Quartus 32-bit | Quartus 10.0 SP1 32-bit on 64-bit Linux, doing a full compile of OpenSPARC T1 for Stratix III (87 KALUTs utilization). Quartus tests are single-threaded with parallel compile disabled. |
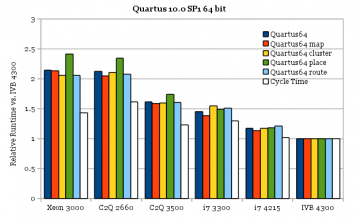
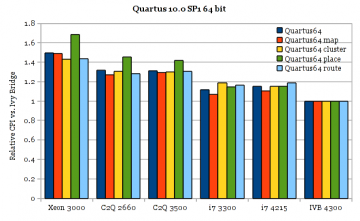
| Quartus 64-bit | Quartus 10.0 SP1 64-bit on 64-bit Linux, same as above. |
| VPR 5.0 64-bit | Modified VPR 5.0 compiled with gcc 4.4.3, compiling a ~9000-block circuit (mkDelayWorker32B.mem_size14.blif) |
Results
Memory Latency and Bandwidth
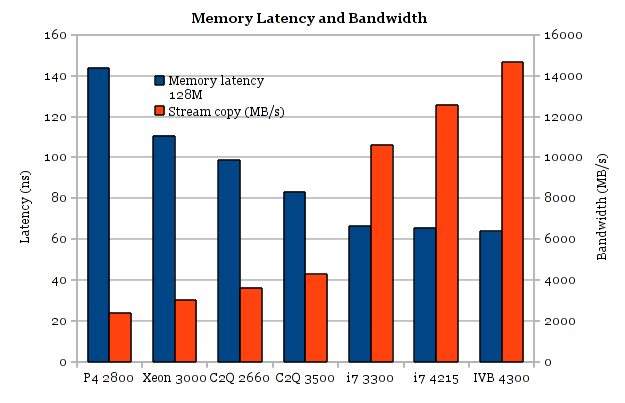
The memory latency on Ivy Bridge is essentially unchanged from the previous microarchitecture (Core i7 Lynnfield/Gulftown), but bandwidth has increased significantly, despite using the same memory (DDR3 ~1600).
FPGA CAD
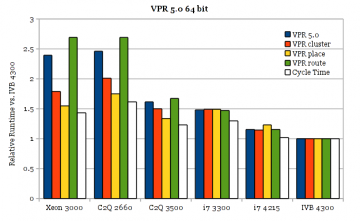
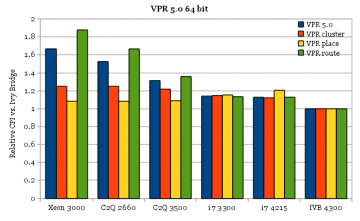
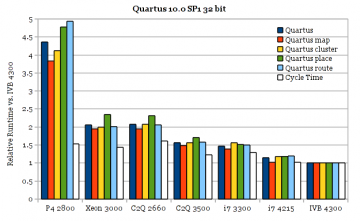
All around per-clock performance improvements of nearly 15% in Ivy Bridge. Stock clock speeds are up about 15% vs. the top-binned Lynnfield (Core i7-880) too. It’s strange how VPR seems to behave differently from Quartus. Quartus placement improves more than clustering and routing over several processor generations, but VPR placement improves less.
Other Benchmarks
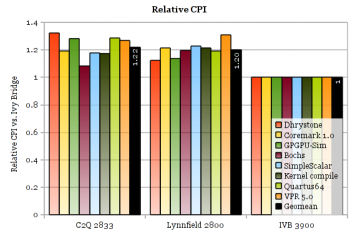
These tests were run on the same systems as before, but clock speeds are lower. These are the same benchmarks used in the next section on simultaneous multithreading.
| System | CPU |
|---|---|
| C2Q 2833 | 45 nm Core 2 Quad Q9550 (Yorkfield) |
| i7 2800 | 45 nm Core i7-860 (Lynnfield) |
| IVB 3900 | 22 nm Core i7-3770K (Ivy Bridge) |
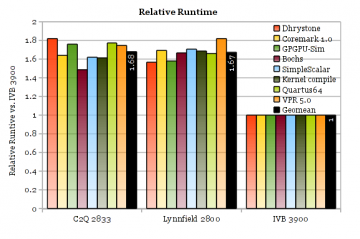
The per-clock performance of Ivy Bridge is 20% better than both Lynnfield and Yorkfield. Surprisingly, Lynnfield doesn’t seem much better than its preceding generation Yorkfield (2% CPI) on these workloads.
The runtime comparisons include the impact of the processors’ clock speeds. The Core 2 (Yorkfield) and Core i7 (Lynnfield) systems are at stock speed, while Ivy Bridge is overclocked by 11%. The graph shows Ivy Bridge a good 60% faster than both earlier chips, which would still be near 50% if all chips were not overclocked. At stock clock speeds, 20% of this gain comes from microarchitectural improvements, and 25% from increased clock speeds.
Hyper-Theading Performance
This section repeats the tests done earlier for Lynnfield’s Hyper-Threading: Hyper-Threading Performance. The Lynnfield results are taken from the measurements made for the earlier tests.
Hardware
| System | CPU | Memory |
|---|---|---|
| i7 3300 | 45 nm Core i7-860 (Lynnfield) | 2-channel DDR3-1580 9-9-9-24, Intel P55 |
| IVB 3900 | 22 nm Core i7-3770K (Ivy Bridge) | 2-channel DDR3-1600 9-9-8-24-1T, Intel Z77 |
Workloads
| Workload | Description |
|---|---|
| Dhrystone | Version 2.1. A synthetic integer benchmark. Compiled with Intel C Compiler 11.1 |
| CoreMark | Version 1.0. Another integer CPU core benchmark, intended as a replacement for Dhrystone. Compiled with Intel C Compiler 12.0.3 |
| Kernel Compile | Compile kernel-tmb-2.6.34.8 using GCC 4.4.3/4.6.3 |
| VPR | Academic FPGA packing, placement, and routing tool from the University of Toronto. Modified version 5.0. Intel C Compiler 11.1 |
| Quartus | Commercial FPGA design software for Altera FPGAs. Compile a 6,000-LUT circuit for the Stratix III FPGA. Includes logic synthesis and optimization (quartus_map), packing, placement, and routing (quartus_fit), and timing analysis (quartus_sta). Version 10.0, 64-bit. |
| Bochs | Instruction set (functional) simulator of an x86 PC system. This benchmark runs the first ~4 billion timesteps of a simulation. Modified version 2.4.6. GCC 4.4.3 |
| SimpleScalar | Processor microarchitecture simulator. This test runs sim-outorder (a cycle-accurate simulation of a dynamically-scheduled RISC processor), simulating 100M instructions. Version 3.0. Compiled with GCC 4.4.3 |
| GPGPU-Sim | Cycle-level simulator of contemporary GPU microarchitectures running CUDA and OpenCL workloads. Version 3.0.9924. |
Throughput Scaling with Multiple Threads
With the exception of the kernel compile workload, all of these tests start multiple instances of the same task and measures the total throughput of the processor (number of tasks/average runtime for task).
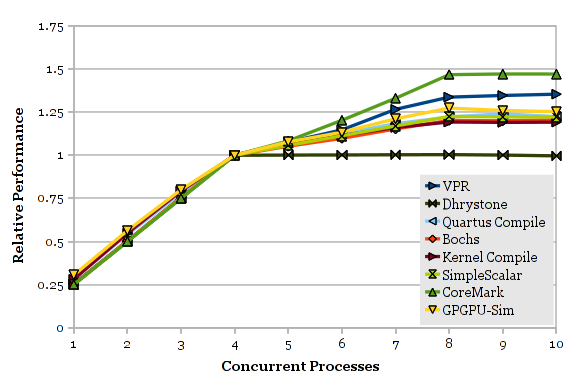
As expected, total throughput increases near linearly with the number of cores used up to 4 (cores are relatively independent), throughput increases slowly between 4 and 8 thread contexts used (Hyper-threading thread contexts are not equivalent to full processors), and is roughly flat beyond 8 thread contexts (time-slicing by the OS does not improve throughput.
Hyper-Threading Throughput Scaling
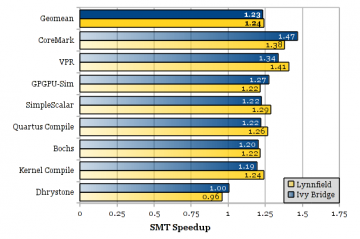
The first chart focuses on comparing the throughput at 8 threads vs. 4 threads for the different workloads. The median geometric mean improvement for HT is 23%. The pathological Dhrystone workload has improved: Although Dhrystone still does not benefit from Hyper-threading, it is no longer slower. It seems like Ivy Bridge gains slightly less from Hyper-threading than Lynnfield. This is not necessarily a bad thing: It could be a symptom that Ivy Bridge is doing a better job utilizing the pipeline with just one thread, reducing the performance gain available for two threads.
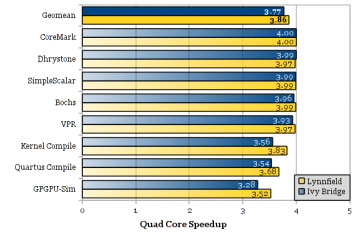
The second chart compares the throughput at 4 threads vs. 1 thread. Ivy Bridge seems to be noticeably worse at this than Lynnfield.
There seems to be no correlation between workloads that scale well on real cores and those that scale well under Hyper-threading. The correlation between the two microarchitectures is higher: Workloads that scale well on Lynnfield tend to also scale well on Ivy Bridge, and vice versa.
Leave a Reply