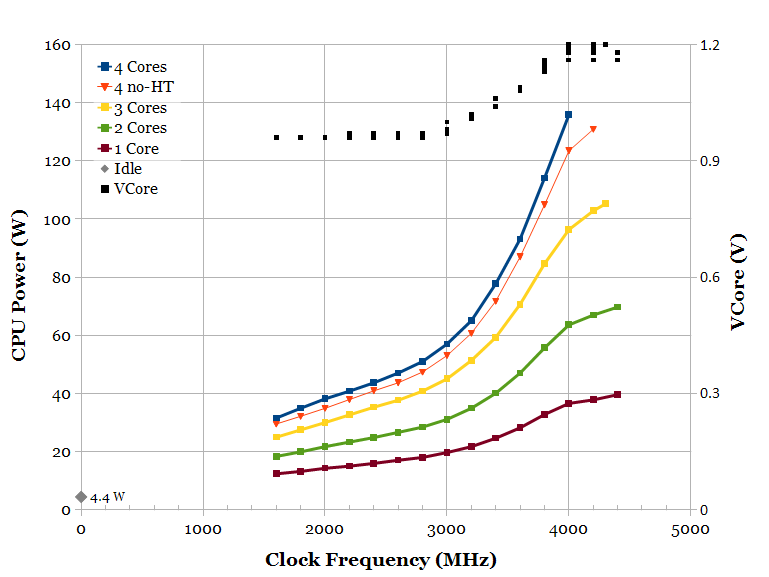
This is a preliminary attempt at characterizing the power consumption of Ivy Bridge at various clock frequencies and loads.
Test Setup
| CPU | Core i7-3770K |
|---|---|
| Motherboard | Gigabyte GA-Z77M-D3H |
| Workload | Prime95 v.27.7, 64-bit Linux |
Current was measured by multimeter at the 12V connector. Power is calculated assuming voltage is 12V. Measuring power at the 12V CPU power connector isolates the power to the CPU, GFX, and power converter losses, without measuring the power consumed by the rest of the system. I don’t attempt to adjust for power conversion losses.
CPU core voltage was measured by the sensor on the motherboard. The GA-Z77M-D3H does not have core voltage adjustments, so I’m limited to observing what Intel’s voltage algorithm decides (which is interesting too).
In addition to frequency and voltage, the number of active cores was also varied. This is accomplished by setting processor affinity to constrain the test workload to run on fewer cores. The data presented here involve running Prime95 on both thread contexts of an active core, except the series testing four active cores without Hyper-Threading. Leaving one of each pair of thread contexts idle measures no-Hyper-Threading power, and leaving both thread contexts idle results in an idle processor core.
Limitations
The most obvious limitation is that I don’t have control over VCore, so I can’t characterize the power consumption of the processor at all operating points, nor can I produce a frequency-voltage schmoo plot.
Temperature affects power consumption (higher temperature causes higher leakage power). In these tests, I used Intel’s stock cooler with PWM set to default, so the core temperature isn’t constant. The stock cooler also limited the maximum frequency I could test without thermal throttling. I did let temperature stabilize before taking voltage and power measurements. I haven’t characterized the dependence of CPU power on core temperature (at the same voltage and frequency).
Results
Power vs. Frequency
Intel’s voltage control algorithm seems fairly simple:
- Below 3 GHz: 0.96 V
- 3 GHz to 4 GHz: Linear increase
- Above 4 GHz: 1.20 V
The voltage is slightly higher when more cores are utilized. In the scatterplot of VCore points, the highest voltage for each frequency is for 4 loaded cores, while the bottom voltage is for 1 loaded core (3 idle cores).
This voltage control algorithm is interesting. Below 3 GHz, VCore is set at 0.96 V, suggesting that the processor isn’t able to run reliably below that voltage (with some safety margin). This is in contrast to Intel’s PR campaign for their 22 nm process which touted leakage reductions at 0.7 V (-37%) through 1.0 V (-18%) compared to their 32 nm process. Ivy Bridge’s actual operating voltage range (0.96 – 1.2 V) is almost entirely outside (and above) the range of voltages presented in Intel’s data. Suspicious.
A second interesting feature is that the voltage increases end at 4 GHz, slightly above the highest turbo frequency bin. Clearly, Intel doesn’t cater to people who overclock beyond the highest turbo bin. Ideally, the voltage-frequency curve should approximate the shmoo plot, which typically has linearly increasing voltage with frequency. This stepped curve is sub-optimal when using a voltage offset (shifting this curve upwards or downwards) when overclocking, where a more desirable curve would be to (super?-)linearly extend the voltage curve beyond 4 GHz. Of course, using a fixed voltage (flat curve) is even less optimal.
Below 3 GHz, where VCore is roughly constant, power consumption increases fairly linearly with frequency, as expected. Power increases roughly cubic with respect to frequency in the region between 3 and 4 GHz because of the linearly-increasing voltage, and the voltage increases returns to ~linear once voltage stops increasing past 4 GHz.
Idle power is an impressive 4.4 W (including voltage converter losses).
Hyper-Threading Power
One of the data series in the plot involves loading all 4 cores with one thread each. This measures the power consumption impact of Hyper-Threading. Comparing 4 active cores with one thread vs. two threads each, Hyper-Threading consumes an extra 8% of power. However, at an average of 22% performance improvement, Hyper-Threading is a power-efficient method of improving performance, provided the workload has enough threads to use it.

Good job, Henry!
Kudos, Henry!
I was always looking for Ivybridge power vs freq & voltage data, but the available power measurement data were always measured at the system level, which include the power consumption from other components. This is most accurate CPU power measurement data that I have seen so far. Idle power of 4.4W is indeed impressive. Could you please share the raw data that was used to plot the graph?
Sure! Here’s a spreadsheet.
Super! Thank you so much!