Introduction
Each new generation of CMOS manufacturing processes brings about a new set of trade-offs. Intel’s recent tradition of manufacturing the same processor microarchitecture across two processes provides an opportunity to look at some of the voltage-delay-power scaling trends. Intel’s new Ivy Bridge processor manufactured on a 22nm tri-gate CMOS process, which is a significant change from the planar transistors used in previous processes. Intel’s previous-generation Sandy Bridge processor made on their 32nm planar CMOS process uses a similar architecture, and can be used as a point of comparison.
In a complete system, a processor’s power consumption, voltage, temperature, and operating frequency can be observed, while the latter three can be controlled. Using those tools, we can measure static and dynamic power as a function of temperature, frequency, and voltage, create shmoo plots (voltage vs. operating frequency), and compare overall thermal resistance.
There have been some rumblings that Ivy Bridge does not overclock as well as Sandy Bridge. On the other hand, Intel claims the 22nm process improves performance over 32nm. Another difference between the two processors is the switch from using solder thermal interface material (STIM) to polymer (PTIM), resulting in increased thermal resistance and higher junction temperatures on Ivy Bridge for the same power. A comparison of the measurements across Sandy Bridge and Ivy Bridge can quantify some of these observations.
Methodology
- Core i5-2500K (32nm Sandy Bridge) and i5-3570K (22nm Ivy Bridge)
- Biostar TZ77MXE motherboard
The TZ77MXE motherboard allows adjustment of processor frequency (multiplier) and voltage, although it does not allow manual adjustment of voltage below 1.0V, or negative voltage offsets.
Power consumption is measured using multimeters on the 12V power connector to measure current and voltage. On modern ATX motherboards, CPU and GPU power regulators are powered by the 12V power connector, which gives a convenient place to measure the current and voltage consumed by the processor package excluding the rest of the system. Power is measured before the processor’s voltage converter. DC-DC converters are typically efficient, so I make no attempt to compensate for it. Voltage is measured at the connector after the ammeter’s voltage drop to reduce the skew caused by the ammeter’s resistance. Switching converters are generally tolerant of varying input voltages (10.9V to 12.2V observed) with minimal impact on efficiency.
The processor’s operating voltage is measured using the on-board IT8728F chip. Temperature is measured using coretemp (CPU on-die temperature sensors), reporting the temperature of the hottest core (usually core 2, cores numbered 0-3).
To control processor operating frequency, I changed only the multiplier while leaving BCLK at 100 MHz. Core voltage is controlled by setting a fixed voltage in the BIOS. I rely on the measured voltage rather than the voltage setting because the actual voltage can vary based on the load line (a mechanism that lowers supply voltage under high load to reduce the peak voltage swing) or “load line calibration” (a mechanism to defeat the load line). Processor temperature is controlled by lowering the cooling fan speed to raise the temperature.
Power consumption (switching activity?) depends strongly on the choice of workload. Power and temperature measurements are made when all four cores of the processor are active running the Prime95 torture test. Prime95 is able to sanity-check its own calculations, so it is also used to check for processor stability when generating a shmoo plot.
Results
Power and Temperature
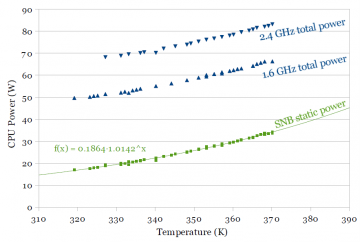
I measure power consumption vs. temperature first, since its results can be used to compensate for varying temperature in later measurements. For both processors, I measure total power at 1.26V at both 1.6 GHz and 2.4 GHz. Total power can be broken down into two components: Static power that does not vary with switching frequency, and dynamic power that varies with switching frequency. Assuming dynamic power scales linearly with frequency, measuring at two frequencies allows extrapolating power consumption down to 0 Hz to separate out dynamic power and static power.
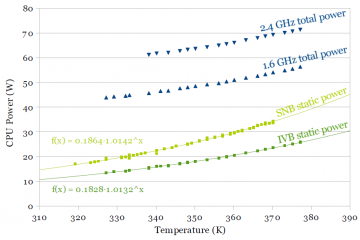
Figure 1a and 1b shows power vs. temperature for Sandy Bridge (SNB) and Ivy Bridge (IVB), respectively. Total power is plotted, as well as the extrapolated static power. Figure 1b plots both Ivy Bridge’s and Sandy Bridge’s static power for comparison. Dynamic power does not depend on temperature, since the 1.6 GHz and 2.4 GHz curves are parallel. The extrapolated static power curve includes data points from both curves translated downwards by twice and three times the difference in power between the two curves. The extrapolated static power data points fits an exponential function very well, which agrees with theory that says leakage power typically grows exponentially with temperature. Ivy Bridge shows a significant improvement in static (leakage) power. One of the claimed benefits of multi-gate transistors is better channel control resulting in a better subthreshold slope and lower subthreshold leakage, and this measurement agrees.
Dynamic Power vs. Frequency
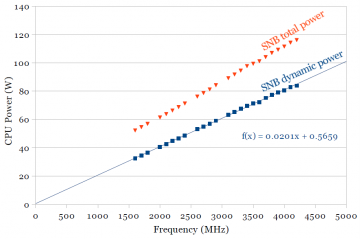
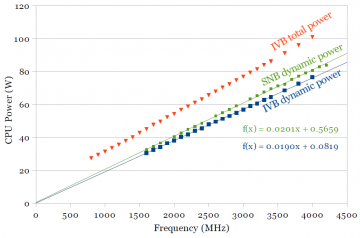
Another classic textbook result is that dynamic power scales linearly with frequency. Figures 2a and 2b show measurements of total power and dynamic power for Sandy Bridge and Ivy Bridge, at 1.26V. Total power consumption is measured, while dynamic power is calculated by subtracting out the temperature-dependent static power found in the previous section.
The dynamic power curve fits a linear trendline very well. The intercept of the dynamic power trendline is expected to be zero (no dynamic power when no switching activity). A non-zero intercept for the trendline indicates some amount of experimental error, around half a watt in these plots. The red curves of total power has a slight upwards curve because total power (static power, but not dynamic power) increases with temperature.
Figure 2b includes the dynamic power curves for both processors for comparison. At 1.26V (an arbitrary voltage somewhat higher than the typical operating point), dynamic power for Ivy Bridge is only slightly lower (~6%). The main objective of this graph was to show that dynamic power increases linearly with frequency. The next section shows how dynamic power scales with processor supply voltage.
Power vs. Supply Voltage
The textbook formula says that dynamic power should be proportional to the square of the supply voltage. This section describes the same measurement. I vary the processor supply voltage while keeping frequency and temperature constant. Like earlier, dynamic and static power is separated by measuring power consumption at 1.6 and 2.4 GHz. I keep temperature constant at 90°C because it is easy to raise the operating temperature by slowing down the cooling fan, but very difficult to lower it. The resulting measurements will show how dynamic power scales with supply voltage and how static power scales with supply voltage at a fixed 90°C temperature.
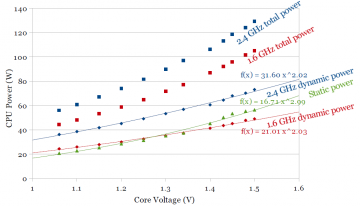
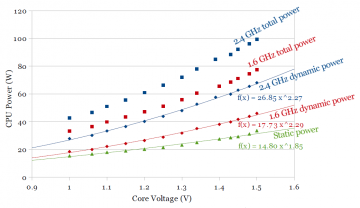
Figures 3a and 3b show the results of these measurements for Sandy Bridge and Ivy Bridge, respectively.
The top two curves in each figure are direct measurements of total processor power at 1.6 and 2.4 GHz. Since total power includes both static and dynamic power, we need to break total power into static and dynamic components before curve fitting. Because temperature is kept constant, each pair of data points at a given voltage have the same static power, so static power can be computed as above, by taking the difference between total power at 1.6 and 2.4 GHz, independently for each voltage, giving the green static power curve. Dynamic power is then computed by subtracting static power from the total power.
For Sandy Bridge (Fig. 3a), the dynamic power fits a power curve well, and comes surprisingly close to the expected quadratic relation, Pdynamic ∝ V2. Static power also fits a power curve (although I’m not aware of theory that requires it), where static power increases roughly as the cube of the voltage.
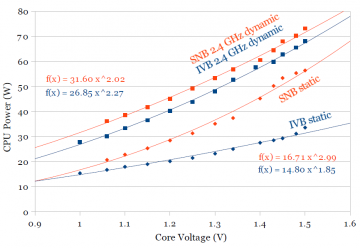
On Ivy Bridge (Fig. 3b), the curve fits are somewhat unexpected. Static power grows much slower than on Sandy Bridge (roughly Pstatic ∝ V1.85 instead of V3), but dynamic power grows slightly more quickly with voltage (Pdynamic ∝ V2.3 compared to V2). A comparison of just the 2.4 GHz dynamic power and static power is plotted in Fig. 3c. Dynamic power on Ivy Bridge is lower for all practical voltages (the curve fit suggests Ivy Bridge dynamic power will exceed Sandy Bridge above 1.9V).
I speculate that these differences (slower static power increase, but slightly higher dynamic power increase with voltage) are properties of tri-gate processes, but I don’t know enough about the differences between planar and tri-gate to know whether these observations match with theory.
Voltage-Frequency Shmoo Plot
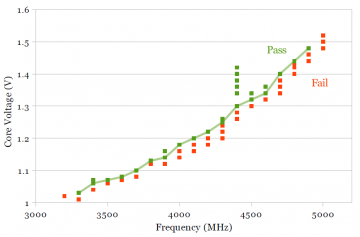
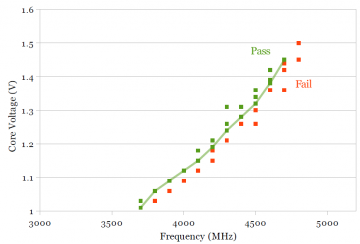
The primary knob for increasing the frequency of a processor is increasing its operating voltage. A shmoo plot characterizes the voltage-frequency relationship by testing a processor at various voltage and frequencies and recording which points function correctly (“pass”) and which do not (“fail”). The boundary between the pass and fail points indicate the lowest voltage at a given frequency (or, alternatively, highest frequency at a given voltage) at which that the processor can still operate, which would correlate to how easily one can overclock the processor.
Unlike the rest of the measurements, the shmoo plots are made while only using one processor core with three cores idle. Prime95 was run on the slowest of the four cores, and a particular voltage and frequency is considered “pass” if Prime95 runs for around 10 minutes without error. The shmoo plots are slightly optimistic: A real-world usage scenario with four active cores instead of one usually requires higher voltage and causes higher temperatures, further reducing achievable frequency. Although running just one active core reduces the effect of temperature (by reducing the temperature change), I do not measure or compensate for the impact of temperature on maximum frequency.
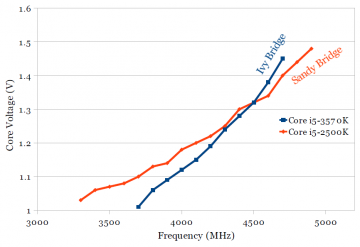
Figures 4a and 4b show the shmoo plots for Sandy Bridge and Ivy Bridge, respectively. Additionally, a line was drawn that connects the lowest voltage that passes at each frequency, which approximates the boundary between the “pass” and “fail” points. Figure 4c shows a comparison of Sandy Bridge and Ivy Bridge. The two boundary lines from Figures 4a and 4b are plotted in Figure 4c. It is interesting that the slope of the Ivy Bridge curve (blue) is higher than for Sandy Bridge. Although Ivy Bridge is significantly faster than Sandy Bridge at low voltages, increasing the operating frequency requires a larger voltage increase on Ivy Bridge, such that the two chips require the same voltage (1.32V) to run at 4.5 GHz. This would suggest that overclocking Ivy Bridge beyond this point is somewhat more difficult, even though Ivy Bridge is faster/lower voltage at the lower non-overclocked frequency (below 3.8-3.9 GHz).
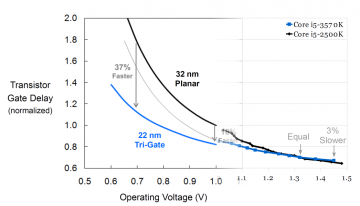
Fig. 5: 22nm Performance improvements, from Intel’s presentations, extended.
One might recall Intel’s initial presentations on their 22nm process showing charts showing performance and/or voltage improvements over their 32nm process. One such graph is reproduced in the left half of Figure 5. Intel’s chart is interesting: The performance and voltage gains claimed are indeed impressive, but the gain decreases at nigher voltages (37% faster at 0.7V, 18% faster at 1.0V), but the typical operating point for the desktop processors is beyond the right edge of the chart (even before overclocking). Is there something unpleasant about the higher (typical!) voltages that Intel didn’t want to mention?
Subject to a few important caveats, Intel’s chart of voltage vs. gate delay is equivalent to a shmoo plot. One caveat is that Intel’s chart shows low-level transistor delays, while a shmoo plot shows the delay of a more complex circuit. In addition, a complex circuit consists of both transistor delay and interconnect delay, so it is expected that performance gains seen at the transistor level will be smaller when applied to a whole processor because interconnect delays are expected to become worse with each process shrink.
Given the above caveats, I have attempted to transform the shmoo plot (by plotting delay instead of its reciprocal, frequency) and overlay that onto Intel’s chart in Figure 5. Notice that the voltage range I was able to test is actually entirely off the right edge of Intel’s chart. My shmoo plot seems to match up reasonably well with Intel’s plot. Although performance improvements at low-voltage are high, the improvement shrinks to around 5 percent at typical operating voltages, and performance improve even turns into a performance loss at higher voltages seen when overclocking.
Thermal Resistance
The ability to cool a processor is determined by its thermal resistance. Power is dissipated at the bottom side of the chip, with most of the heat being dissipated through the top side. Most of the heat must pass through the silicon die, heat spreader, heatsink, then out to air, with some form of thermal interface material in the interface between each of those. The overall thermal resistance can be measured by measuring the power dissipation and total temperature difference between the on-die temperature sensors and ambient air.
There are two main reasons why Sandy Bridge and Ivy Bridge may have different thermal resistance. First, as chips are scaled smaller, power dissipation does not scale as much, leading to higher power density. Ivy Bridge’s die size (160 mm2) is 26% smaller than Sandy Bridge’s (216 mm2), reducing the contact surface area between the die and heat spreader. Second, Intel has switched from using solder between the die and heat spreader (solder thermal interface material, STIM, ~87 W/mK) to a polymer material (PTIM, 3-4 W/mK), presumably because Ivy Bridge’s reduced power dissipation is now comfortably within the range suitable for using PTIM (See Figure 16).
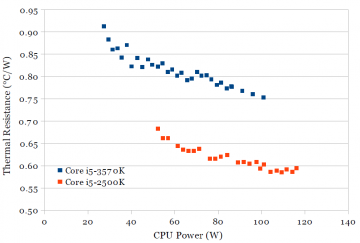
Thermal resistance is measured with all four cores active (fewer active cores results in a hot spot). The stock thermal paste, heatsink, and cooling fan are used on both processors. The cooling fan is kept at its maximum constant speed (around 2050 RPM), and power dissipation is varied by changing the CPU supply voltage.
Figure 6 shows a measurement of the thermal resistance on both processors. On both processors, thermal resistance improves somewhat at higher power. The thermal resistance of Ivy Bridge is around 0.15 °C/W worse than Sandy Bridge. Although it’s not possible to break down the contribution of the two reasons, it seems likely that most of the increase in thermal resistance is due to the change in TIM. An increase of 0.15 °C/W roughly corresponds to the bulk thermal resistance of a ~90 μm layer of PTIM over the die area of 160 mm2.
Summary
The above measurements attempt to characterize some of the changes when moving from Intel’s 32nm planar to 22nm Tri-Gate process. The 22nm Ivy Bridge significantly improves on static (leakage) power over 32nm Sandy Bridge, but only shows small reductions in dynamic power. Ivy Bridge also requires higher voltage increases for the same frequency increase, leading to more difficult overclocking but power savings at lower (standard) speeds.
In addition to the CMOS process changes, the thermal resistance of Ivy Bridge increased over Sandy Bridge, likely due to the change from solder to polymer thermal interface material between the die and heat spreader.
Cite
- H. Wong, A Comparison of Intel’s 32nm and 22nm Core i5 CPUs: Power, Voltage, Temperature, and Frequency, Oct., 2012. [Online]. Available: http://blog.stuffedcow.net/2012/10/intel32nm-22nm-core-i5-comparison/
[Bibtex]@misc{ivb-vs-snb, author={Henry Wong}, title={A Comparison of {Intel}'s 32nm and 22nm {Core i5} {CPUs}: Power, Voltage, Temperature, and Frequency}, month={oct}, year=2012, url={http://blog.stuffedcow.net/2012/10/intel32nm-22nm-core-i5-comparison/} }
Just wanted to say thank you for a fantastic report. I appreciate the time and effort put into this analysis; the information was thorough and helpful.
Wow.. This report is more impressive than the previous IVB report, which was fantastic! Could you please share the raw data?
Is there some particular bit of the data you’re looking for? I still haven’t gotten around to cleaning up the entire spreadsheet…
Very nice work and impressive. There are questions on why 1V Vcc not going down yet to 0.7Volt for 22nm and beyond. Also what makes dynamic power law V^2.3, in principal power is a square law with voltage , proven before many times. Unless there is a weak dependence of capacitance with voltage.CoV^.3 etc.
I suppose subthreshold leakage current increasing exponentially with decreasing transistor threshold voltage still prevents lowering the supply voltage too much(?). There was also some mention of reliability challenges at low supply voltages for big SRAMs (e.g., “Dynamic Cache Shrink”, reduces 2MB L3 cache to 256KB at low voltage., “A 22nm IA Multi-CPU and GPU System-on-Chip” in ISSCC 2012).
I have no idea why dynamic power scales as V^2.3. Hopefully having a measurement will prompt someone who knows the theory to explain it… 🙂
Hello,
This report is very impressive, I was looking for information concerning dynamic/static power in sub 45 nm chips (especially since tri-gate transistors) and this is very accurate !
Could you please share the data ? I hope you’ve finished cleaning the datasheets
No, not really done cleaning up the spreadsheets. But here’s a mostly-sanitized version of the data. Hopefully it’s understandable.
http://blog.stuffedcow.net/wp-content/uploads/2012/10/Corei5-32-22.ods
FAN-TA-STIC !! congrats !
Hey henry, This is very interesting post. I am doing my research something related to this. I want to setup this experimental setup in my lab and might need your guidance. Please email me and let me know if you can help me regarding the same.
in the right half of Figure 5, snb get better performance because more leakage current help snb ?
Hmm… I don’t think I would come to that conclusion, though I’m no expert at CMOS processes.
There is the trade-off between transistor speed and leakage, but that’s not something specific only to particular voltages. I also don’t think it’s valid to make this comparison between different transistor types.
Performance should be related to transistor drive strength (Idsat or Ieff). I don’t think how Idsat varies with increasing VDD (i.e., its slope) is related to the choice of transistor leakage. I find it believable that FinFET drive strengths are less sensitive to voltage than planar, but I don’t know why. (I imagine it has something to do with FinFETs having a finite channel width, so driving it with abnormally high gate voltages won’t make it any wider, unlike for planar bulk transistors. But I have no idea whether this is correct.)
leakage between source and drain seem to be helpful for high frequency.
if yes, increase a little voltage on gate, allow some current but the “true” state of transistor is kept,
that could help us to get high frequency with fewer voltage ?
I think what you’re describing is correct. It’s equivalent to lowering the threshold voltage (Vt) of the transistor, to make it slightly more “on” in its default state. Lowering Vt does make the transistor faster at the same Vdd. The trade-off is that off-state subthreshold leakage increases (~exponentially).
In practice, Vt is tuned rather than increasing the off-state gate voltage, because the gate is driven by the output of another logic gate, and there’s no good method of making the output voltage non-zero. (See Wikipedia: Multi-threshold CMOS). CMOS manufacturing already provides multiple Vt options. Some Altera FPGAs change the back bias voltage to adjust Vt (leakage and delay) depending on timing criticality.
In this case the leakage will not change a lot if we can keep socket temperature, and because transistor is fully busy, total power almost equal to dynamic power,
so a * C *V *V *f seem to help us to save total power?
I’m not entirely clear what method you’re proposing…
If you’re proposing that the “off” voltage be slightly higher than zero:
– In the off state, having a non-zero off voltage increases subthreshold leakage, which is exponential in Vgs. (Subthreshold leakage is related not just to temperature and Vdd, but also to your off-state gate voltage.)
– In the on state, the transistor on-current (which affects switching speed) is dependent on (Vgs-Vt), and Vt didn’t change. However, because the “on” voltage is now lower than Vdd, so you may even need to raise Vdd to get the same speed.
– Also, I can’t think of a method to actually implement this in practice, because gate voltages are driven to Vss or Vdd by other transistors, and there is no way to generate a gate voltage that isn’t Vss or Vdd.
All of the above can be achieved without increasing Vdd by making transistors with lower Vt.
– But that’s a trade-off between speed (and Vdd) vs. leakage. Leakage is not negligible: The measurements I made above show static power at about 20-30% of total power at 2.4 GHz. Because leakage increases so quickly with Vt (exponential), there isn’t much speed gain left by lowering Vt.
Dynamic adjustment of body bias voltage to reduce leakage during idle or low-speed operation?
– Sounds promising, and I don’t know if it’s being done currently, but I doubt it’s a new idea. US patent 8364988 (Renesas) seems to be describing this.
First, I felt obliged to leave appreciation for this work. Great presentation of results for a non-specialist audience like myself. And careful choice of words to remain readable yet precise. Thank you!
Second, I’ve got two questions:
– Regarding Fig.1a and static power curve. How come you have data points at low temperatures like 320K. There is a readout of total power at 1.6 GHz at 320K. Yet there’s no respective point in the 2.4 GHz graph for obvious reasons. But to calculate static power at 320K you need both data points, don’t you?
– Are there similar measurements for 14-nm process? You show that the problem with leakage had somehow alleviated in transition from 22 nm to 32 nm. Yet other sources say, that leakage power becomes more and more relevant as the process diminishes.
to correct myself. please read *in transition from 32 to 22 nm )
Hi, thanks for the kind words.
1: Yes you do need both 2.4 and 1.6 GHz data points to calculate the static power. I cheated slightly here: I curve-fitted the 2.4 and 1.6 curves first, took the difference of those curves (not the data points), and then shifted down both sets of data points by (2x and 3x) of the difference. If I had to match up each 2.4GHz data point with a 1.6GHz data point at exactly the same temperature, I would end up with too few data points… I controlled the temperature by holding a piece of cardboard to partially block the CPU fan and waiting for the temperature to settle, so it was quite tiring to collect each data point, and wasn’t thinking about exactly which temperature points I wanted…
I haven’t looked for 14nm data. I haven’t measured 14nm processors either, as I haven’t had time, and I still haven’t bought any 14nm processors yet (I bought a lot of 22nm Haswells though…) 🙂
I’m no expert: I think you’re right that in general, smaller processes result in worse leakage. But certain features give “one-time” improvements that counter this trend. For example, high-K gate dielectrics (new in Intel 45nm “HKMG”) reduce gate leakage, while finFETs (new in Intel 22nm, and improved in 14nm and 10nm with taller fins) reduce subthreshold leakage. There are still some tricks to come, such as “Gate all around”, and maybe tunnel FETs. How many of these “one-time improvements” will there be?
Hi
Very impressive work being done by you.Really feeling obliged to appreciate this master piece. I wanted to have a little confirmation regarding the Total Power Consumption: My doubt is, at any operating temperature and for any operating frequency, Lets say that circuit operating at 1.6 GHz and 370K. For SNB processer, the static power (due to Leakage) consumption is dominating the dynamic power consumption right? By when we move to IVB, the effect of leakage is going down. Can you please provide the split of Leakage power
Congrats
Thanks again for your effort and showing us the data
Hi Anil,
I don’t really understand your question. Yes, for SNB 1.6 GHz, the static power (~34W?) is more than half of the total power (~66W), so static power is higher than dynamic power. And yes, IVB seems to have lower static power.
What do you mean by “split of leakage power”? I can only measure dynamic (varies linearly with MHz) and static power (does not vary with MHz). I can’t further split static power into its causes… (?)
On the other hand, if you’re asking about dynamic vs. static power for each processor, the data is on the chart. snb_temp.png and ivb_temp.png show 2.4 GHz, 1.6 GHz, and static power for SNB and IVB, respectively.