Modern processors use branch predictors to predict a program’s control flow in order to execute further ahead in the instruction stream, for better performance. Function return instructions usually use a specialized branch predictor called a Return Address Stack (RAS), Return Stack Buffer (RSB), return stack, or other various names. This article presents a series of increasingly complex microbenchmarks to measure the behaviour of the RAS found in several Intel and AMD processor microarchitectures.
I first measure function calls and returns and confirm that return prediction is more accurate than treating function returns as indirect branches, and confirm that a function “call” to the immediately following instruction is not treated as a call. The microbenchmark is then extended to measure RAS capacity and to test the behaviour of the RAS after pipeline flushes. Several microarchitectures sometimes suffer from an incorrect RAS top-of-stack pointer after a return misprediction. AMD Bulldozer’s RAS behaviour is particularly strange (the TOS is off by 1 until the next correctly-predicted return) and feels like a performance bug. Intel’s RSBs behave like a circular array (with no underflow checking), while AMD’s RASes seem to have overflow/underflow checking.
A variation of the microbenchmark was used with Intel CPU performance counters to measure the maximum number of speculative branches and calls that can be in-flight. The number of in-flight calls is limited to 13 to 15 (possibly related to the RAS), while the maximum number of in-flight branches is much higher. On P6-derived microarchitectures, the number of in-flight branches seems to be limited by the reorder buffer size, while Sandy Bridge to Haswell are limited to 48, probably indicating a new hardware structure that holds branches.
Table of Contents
- Background: Branches and branch prediction
- Measuring the basic operation of the return address stack
- Measuring return address stack capacity
- Mispredicted and misaligned returns
- Speculative execution: Repairing the RAS after a pipeline flush
- Detecting RAS misalignment
- Further experiments on AMD Bulldozer
- Maximum in-flight branches and calls
- Conclusions
- Appendix 1: Microbenchmarking is hard
- Appendix 2: List of processors tested
- References
Summary of Results
| Capacity | RAS corrupted on return misprediction | Max. in-flight calls | Max. in-flight branches | |
|---|---|---|---|---|
| Pentium Pro | 16 | No | 13 | 40 |
| Core 2 45nm | 16 | Sometimes | 19 | 91 |
| Lynnfield | 16 | Rarely | 15 | 123 |
| Sandy Bridge | 16 | Sometimes | 15 | 48 |
| Ivy Bridge | 16 | Sometimes | 15 | 48 |
| Haswell | 16 | Rarely | 14 | 48 |
| Phenom | 24 | No | ||
| Phenom II | 24 | No | ||
| Bulldozer | 24 | Always: TOS pointer off by 1 | ||
| Piledriver | 24 | Sometimes | ||
| VIA Nano U3500 | 16 fetch 32 translate |
Background: Branches and branch prediction
Branch operations are a common part of every computer program. These include conditional branches to implement if-then constructs, and call and return instructions to implement functions. In a pipelined processor, instructions are fetched many cycles earlier than when they are executed, so the outcome of branch instructions, and therefore what to fetch next, aren’t known until many cycles later. To avoid wasting time waiting for the branch outcome, the processor front-end uses branch prediction to continue fetching instructions past branches, by guessing which execution path is likely to be taken. In deeply-pipelined processors, accurate branch prediction is crucial for achieving high performance, so processors usually have specialized branch predictors to predict different types of branch instruction. This article focuses on the return address stack predictor used to predict function return instructions.
Types of branches
Two ways to classify branch instructions are by whether the branch is conditional or unconditional, and whether the branch target is direct (can be calculated statically) or indirect (depends on a register value that is unknown until run time). There are four possible combinations:
- Unconditional, direct: branch, call
- Unconditional, indirect: branch, call, return
- Conditional, direct: branch
- Conditional, indirect: none in x86
For conditional branches, a branch predictor needs to predict whether a branch is taken. Conversely, unconditional branches are always taken. For direct branches, there is only one possible branch target, so the branch target is easier to predict than for indirect branches, which can have multiple branch targets. High-performance processors usually have specialized predictors for each type of branch: A direction predictor for conditional branches, a branch target buffer (BTB) to predict the branch target of direct branches, a different branch target buffer to predict the branch target of indirect branches, and a return address stack (RAS) or return stack buffer (RSB) to predict function return instructions.
Why are returns special?
Return instructions are indirect branches, so they can have multiple branch targets and can be difficult to predict. The multiple branch targets come from the fact that functions can be called from multiple sites (code reuse), and the return must branch back to the caller, which can be different every time. What makes function returns special is that in most sane programming languages, function calls and function returns are matched, and functions are nested in a last-in-first-out order. A hardware stack-like structure would be able to accurately predict function return target addresses by pushing the location of each call instruction that executed, then popped it off for each return instruction. This stack-like predictor structure is the return address stack.
Measuring the basic operation of the return address stack
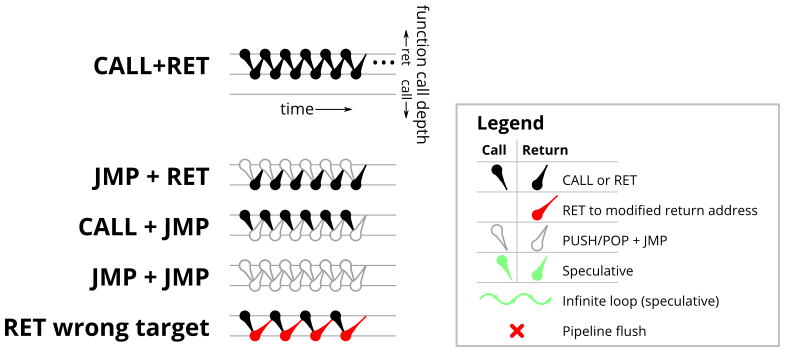
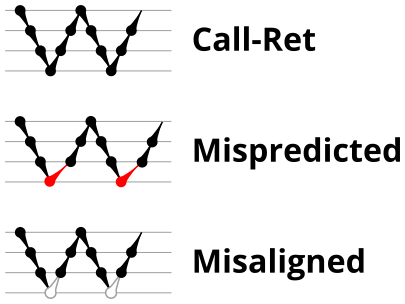
To test the basic operation of the return address predictor, we’ll start with a simple microbenchmark (shown in Figure 1) that simply calls an empty function repeatedly. In this particular case, the loop is unrolled 16 times, so there are 16 different call sites all calling the same function. Figure 2 shows a sketch of the dynamic runtime behaviour of this program, which I’ve labelled CALL+RET. The horizontal axis is time increasing to the right, and the dots show the depth of the call stack as time progresses. This microbenchmark repeatedly executes one call instruction (which increases the call depth by 1, so the next dot is drawn one level lower) followed by one return instruction (which decreases the call depth by 1).
The microbenchmarks used in the rest of this article are essentially extensions of the basic code in Figure 1. They will get progressively more complex, so I will be using diagrams to explain them rather than code fragments.
Properly-matched calls and returns
If the RAS works as expected, all of the calls and returns should be correctly predicted (assuming direct call instructions are easily predicted). We’ll measure the runtime of the loop, then divide by the number of calls and get the number of clock cycles for each call and return pair. The Table 1 below shows the results. On every microarchitecture, properly-matched calls and returns results in correctly-predicted return addresses, executing a call and return in around 3-6 cycles (See Table 1, CALL+RET column).
LOOP:
	call F
	call F
	call F
	...
	call F
	jmp LOOP

F:	ret
| CALL + RET | JMP + RET | CALL + JMP | JMP + JMP | RET to wrong target | |
|---|---|---|---|---|---|
| Pentium Pro | 4.4 | 16.1 | 15.4 | 16.1 | 22.9 |
| Core 2 45nm | 4.25 | 19.1 | 4.25 | 4.4 | 26.1 |
| Lynnfield | 4.4 | 21.4 | 4.4 | 4.4 | 28.7 |
| Sandy Bridge | 4.25 | 25.7 | 4.25 | 4.4 | 30.6 |
| Ivy Bridge | 4.25 | 25.8 | 4.25 | 4.4 | 30.5 |
| Haswell | 3.3 | 26.0 | 3.3 | 3.6 | 32.5 |
| Phenom | 5.5 | 17.4 | 18.5 | 17.4 | 22.3 |
| Phenom II | 5.5 | 17.6 | 14.2 | 7.4 | 22.3 |
| Bulldozer | 4.25 | 26.4 | 7.25 | 7.4 | 40.4 |
| Piledriver | 4.25 | 27.4 | 7.25 | 7.4 | 34.3 |
| Nano U3500 | 8.69 | 26.69 | 30.75 | 26.69 | 33.8 |
Improperly matched call-returns and BTB predictions
Each CALL and RET instruction can be replaced by a functionally-equivalent pair of PUSH/POP and JMP instructions. The main difference is that a JMP is not treated as a call or return for the purposes of branch prediction. Table 1 (above) shows all four combinations, where each call or return may be replaced with a PUSH/POP+JMP. Out of the four combinations, CALL+RET has properly matched calls and returns, JMP+RET has returns are not matched to any calls and causes return mispredictions, and the remaining two cases use the indirect branch predictor (BTB) rather than the RAS to predict the return address.
In all processors, properly-matched calls and returns results in perfect return prediction, while improperly matched returns (JMP+RET) results in all returns being mispredicted. The branch prediction accuracy of the remaining two cases depends on the indirect branch predictor (BTB). Recall that the results in Table 1 uses a microbenchmark that cycles through 16 unique call sites. For the Pentium Pro, the BTB always mispredicts, because there are too many call sites for the BTB to remember. Newer processors with improved indirect branch prediction has better prediction accuracy. On newer AMD processors (Phenom II, Bulldozer, Piledriver), indirect branch prediction accuracy is improved but not perfect (runtime improves further when there are even fewer call sites). The newer Intel processors achieve perfect branch prediction accuracy with 16 call sites, but unrolling the loop even further to create more call sites causes these CPUs get indirect branch mispredictions too (data not shown).
Incorrect return targets
The final column in Table 1 shows what happens when native CALL and RET instructions are used, but the return address is modified on the stack in memory before returning. Unsurprisingly, this produces return address mispredictions. The execution time for all processors (except Bulldozer) is about 5-7 cycles higher than for the JMP+RET misprediction because the instruction that modifies the return address on the stack consumes execution time. The incorrect return target is created by incrementing the return address on the stack in memory, which probably results in a store-to-load forward from the CALL, increment, and then a store-to-load forward to the RET instruction. (A previous blog post explored store-to-load forwarding on x86 processors)
Special case: CALL +0 is not a call
Most x86 processors treat a CALL to the immediately following instruction as though it were not a function call. Firstly, calling the next instruction is not used for calling a function because a return would return to the beginning of the function being called. Secondly, on x86, calling the immediately-following instruction then popping the return address is the idiom used to retrieve the current instruction pointer (for IP-relative addressing, before x86-64 added IP-relative addressing modes). In the following code listing (Figure 3), the function get_current_ip appears to have an extra call that would cause the RAS predictor to be misaligned (and also mispredict the return) if call-to-next-instruction were not handled as a special case.
get_current_ip:
	call 1f
	1: pop %eax
	ret
| CALL+RET | get_current_ip | |
|---|---|---|
| Pentium Pro | 4.4 | 11.4 |
| Core 2 45nm | 4.25 | 6.0 |
| Lynnfield | 4.4 | 4.4 |
| Sandy Bridge | 4.25 | 4.25 |
| Ivy Bridge | 4.25 | 4.25 |
| Haswell | 3.3 | 3.4 |
| Phenom | 5.5 | 7.5 |
| Phenom II | 5.5 | 7.5 |
| Bulldozer | 4.25 | 5.2 |
| Piledriver | 4.25 | 4.25 |
| Nano U3500 | 8.69 | 34.0 |
Table 2 shows the runtime of the above routine on each processor. For every processor except for the Nano U3500, calling get_current_ip is nearly or equally fast compared to calling an function with a single return instruction. This indicates that CALL +0 is usually treated as a special case, and get_current_ip does not cause a return misprediction.
Measuring return address stack capacity
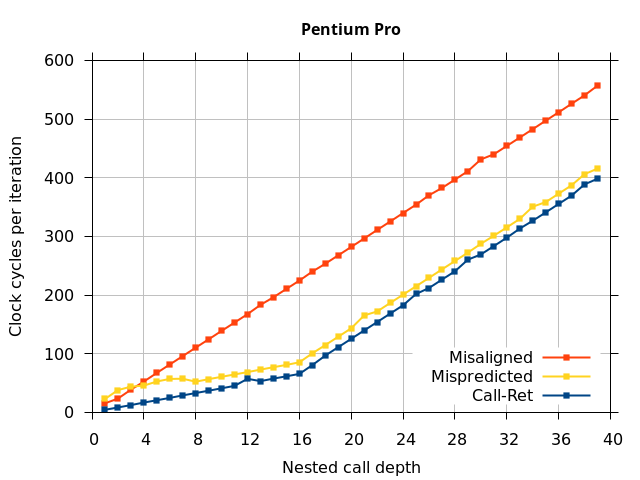
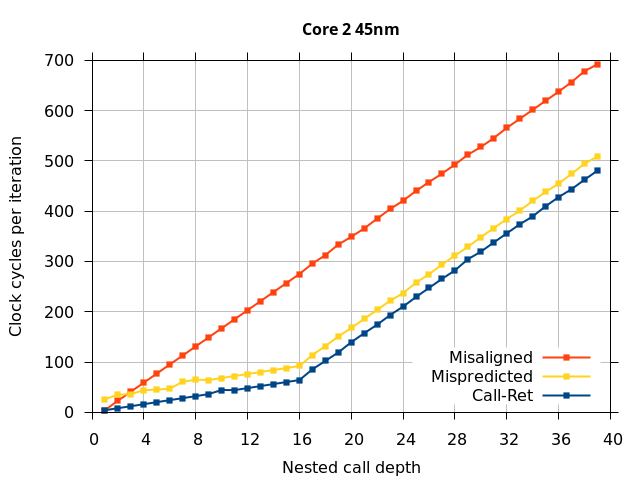
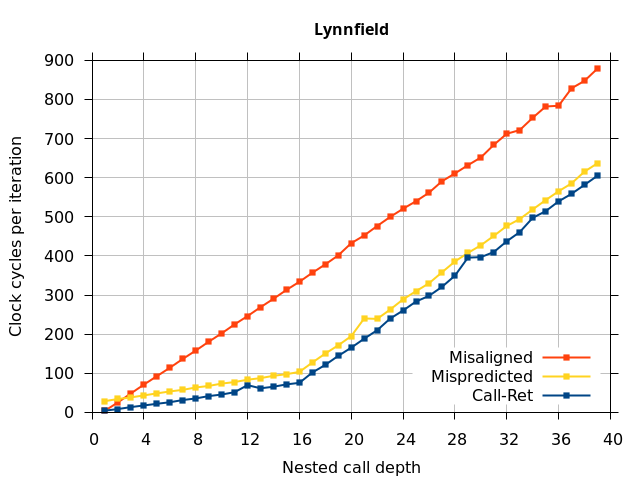
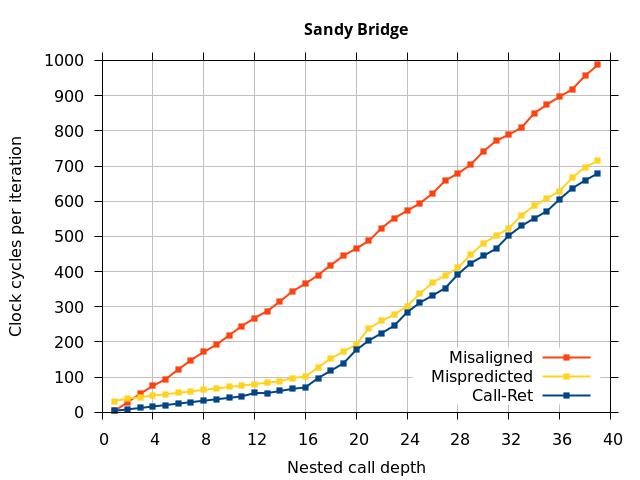
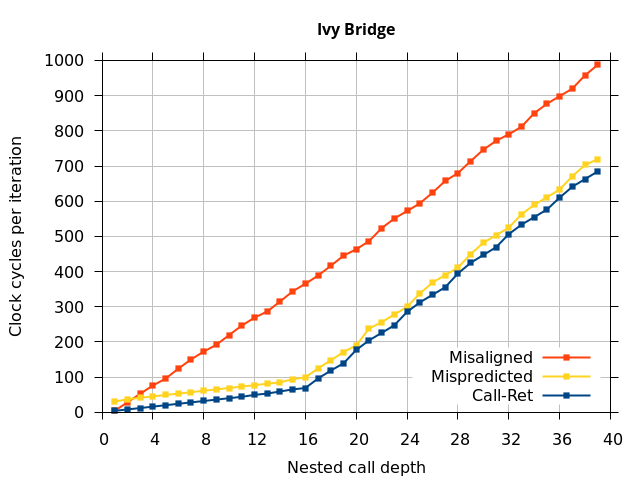
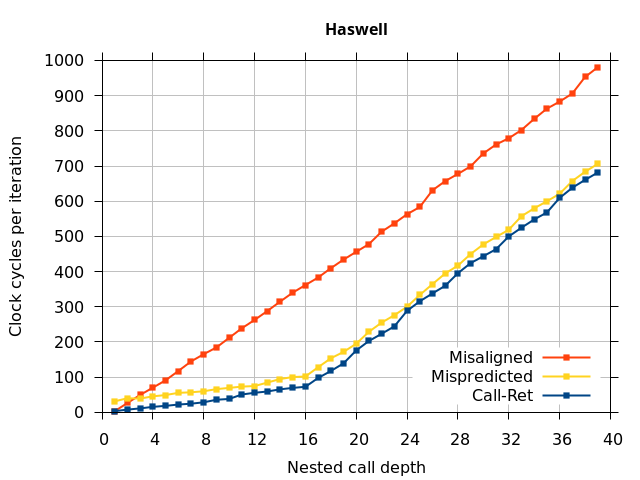
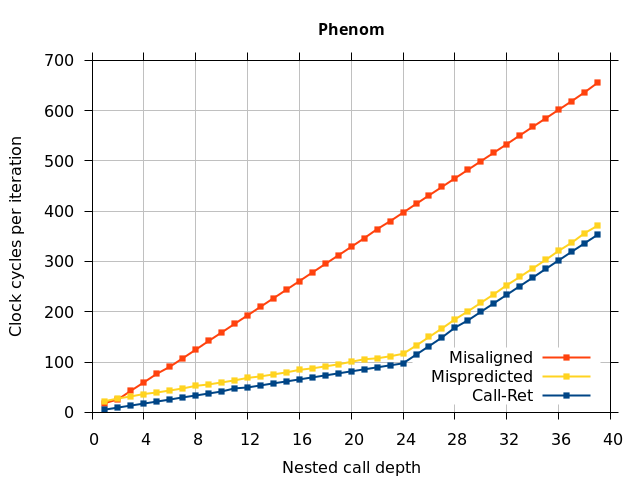
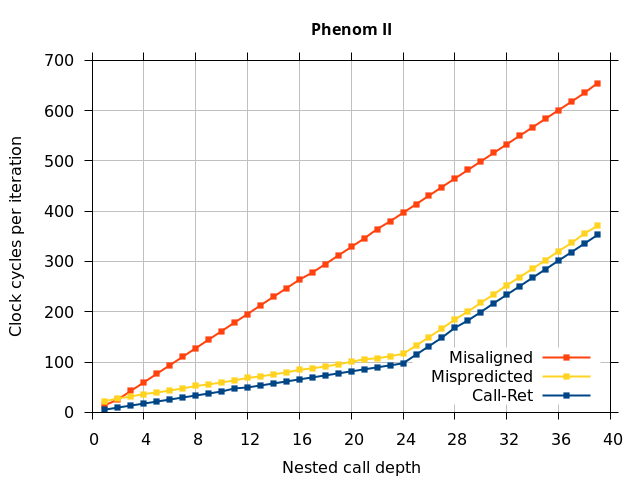
Like all on-chip structures, the return address stack has a finite size. Since the RAS behaves like a stack, each level of function call nesting requires an entry in the stack. For deeply-nested function calls, a finite-sized stack can overflow, causing earlier return addresses to be forgotten and return address mispredictions to occur. One way to measure the size of the RAS is to measure the runtime of nested functions, then increasing the nesting depth until branch mispredictions occur. (Note that with speculative execution and fancy RAS designs that might involve renaming, the RAS capacity we’re measuring here does not necessarily include any extra entries reserved for speculative-only state, if any.) The results of this microbenchmark are shown in the Call-Ret series in Figure 4.
Pentium Pro
Core 2 45nm
Lynnfield
Sandy Bridge
Ivy Bridge
Haswell
Phenom
Phenom II
Bulldozer
Piledriver
Nano U3500
Microbenchmark diagram
The “Call-Ret” (blue) series in the graph shows the time per iteration for executing some number of nested function calls (x axis) followed immediately by the same number of returns. (The Microbenchmark diagram in Figure 4 shows the sequence of instructions for a depth of 3). The runtime vs. call depth curve shows a distinct bend when the function call depth matches the RAS capacity (e.g., 16 for Pentium Pro). For shallow call depths, each additional call-return adds two correctly-predicted branches to the inner loop, but for call depths greater than the RAS capacity, each additional call-return also adds a return address misprediction.
RAS capacities are routinely disclosed by the CPU manufacturers (other than VIA), and Agner Fog has also independently published these numbers in his microarchitecture descriptions [1], so the RAS capacity measured here merely confirm the existing numbers. The method to measure them is also quite straightforward, though I haven’t seen the methodology described elsewhere yet.
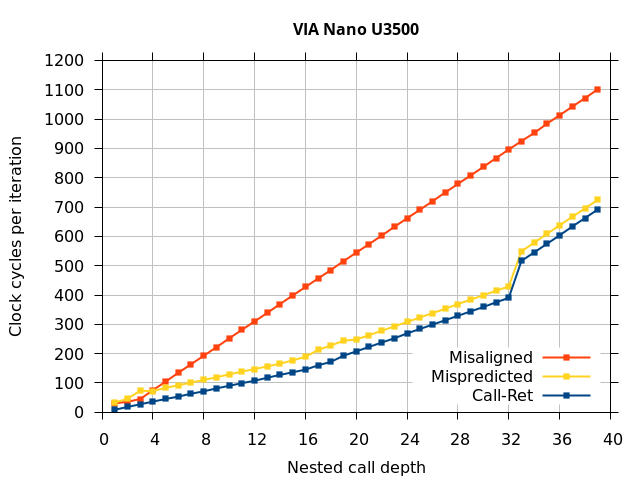
VIA Nano U3500
To my knowledge, the Via Nano return stack capacity has not been previously disclosed nor successfully measured. My test shows that the (largest) RAS in the Nano U3500 has 32 entries (See the Nano 3500 tab of Figure 4). There is a bend in the curve at a nested call depth of 16 (from about 9 clocks for each extra nested function to about 15 clocks each). Given that VIA has stated that there are at least two RAS predictors (one at the fetch stage and one further down the pipeline after instruction translate)[2], my interpretation of this data is that the fetch-stage RAS has a capacity of 16 entries, while the translate-stage RAS has a capacity of 32 entries, with a roughly 6-cycle penalty when the fetch-stage RAS is incorrect and overridden by the translate-stage RAS.
The VIA Nano U3500 RAS capacity was particularly difficult to measure. Unlike other processors, the Nano does not unconditionally use the RAS to predict returns, but it learns the behaviour of each return instruction to decide whether to use the RAS for that return. It seems to fall back to using the BTB indirect branch predictor for a return instruction if that return was recently mispredicted in the past. One implication of this behaviour is that the basic retpoline[3] will probably not work on a Via Nano U3500. To work around this behaviour, the Nano U3500 measurement used a modified test that uses only one static return instruction (making all functions share the same ret instruction), ensuring that a BTB cannot correctly predict the return’s target address. Due to the effort required to change and verify the microbenchmark, I only ran the basic tests on the Nano U3500.
The shape of the Nano U3500 curve differs from the other processors (a sharp jump at the RAS capacity instead of a bend) because the first misprediction (at depth 33) causes the processor to refuse to use the RAS to predict some of the other returns that could have otherwise been correctly predicted.
Mispredicted and misaligned returns
When using the RAS for its intended purpose (properly-matched nested function calls), all of the microarchitectures behave as expected. But how does the processor handle imperfections such as a misprediction or misalignment?
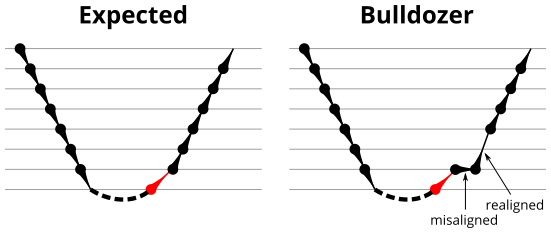
To test this, we tried two variations of the microbenchmark. To test the response to a misprediction, the return for the deepest function is modified to return to a different address (1 byte later than the original return address), but all of the other calls and returns remain matched, and the number of calls still equals the number of returns. Ideally, this should cause one branch misprediction more than the earlier case. The Mispredicted series in the Figure 4 shows the results of this test.
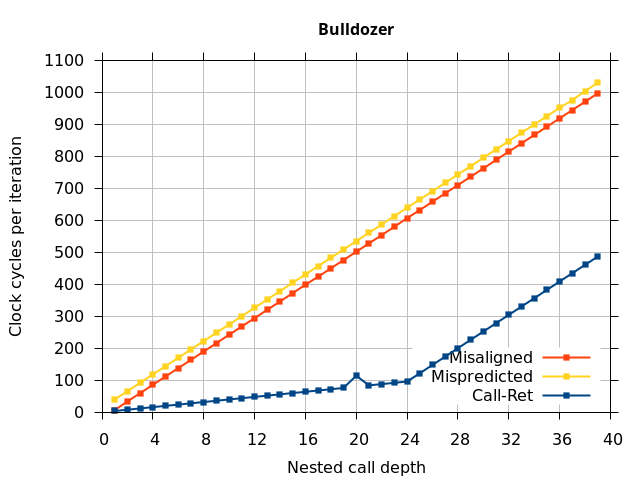
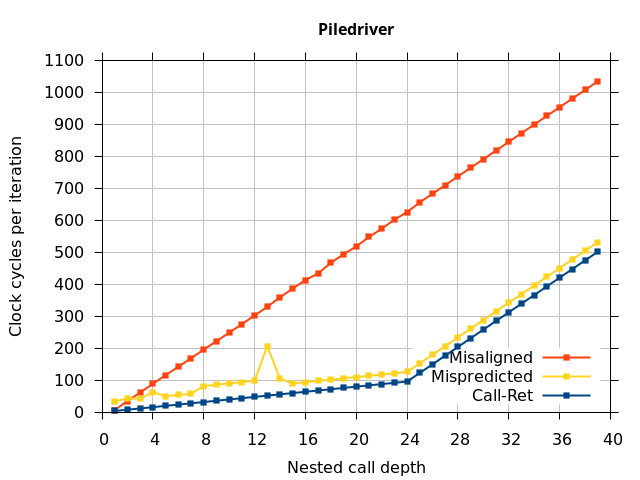
We expect that the Mispredicted trace should be shifted upwards by the cost of one branch misprediction compared to the Call-Ret trace. This is true for most microarchitectures. However, Pentium Pro and Piledriver shows slightly more delay (branch mispredictions) than expected, while a single misprediction on Bulldozer causes all of the subsequent returns to be mispredicted. We will look more closely at Bulldozer in a later section, which shows that the probable reason for this behaviour is that Bulldozer does not correctly restore the RAS top-of-stack pointer.
A RAS misalignment occurs when the number of function returns does not match the number of calls. This can cause many mispredictions because the RAS can no longer match returns to its corresponding call. To test misalignment, the microbenchmark is modified so that the return from the deepest function is replaced with a POP and indirect JMP performing the same operation. This sequence behaves the same as a return, but is not recognized as a return, which causes the number of calls and returns to be unbalanced. From the point of view of the return address predictor, there is now one more call than return. The Misaligned series in Figure 4 shows that for all microarchitectures, misalignment causes all subsequent returns to be mispredicted.
Speculative execution: Repairing the RAS after a pipeline flush
The above descriptions of the return address stack predictor described its functional behaviour but did not account for speculative execution. All modern processors use some form of speculative execution, which can include speculative calls and returns that speculatively modify the RAS. Updating the RAS speculatively is necessary for correct prediction of short functions, where the return follows soon after the call (in the extreme case, an empty function has a return instruction immediately after the call). However, if the RAS state is updated speculatively, there needs to be a mechanism to roll back (some of) these updates. Although rolling back the state is not necessary for correctness, there can be a significant performance loss if it is not done [4]. The need to repair the return address predictor state after a pipeline flush increases the complexity of the predictor, and an incomplete or incorrect repair may be detectable by an appropriate microbenchmark.
There are two main things that need rolling back: The RAS’s top-of-stack pointer, and any entries that were overwritten by speculative calls. Recovering the top-of-stack pointer is most important. Failing to do so leaves the RAS misaligned, which causes the entire contents of the RAS to be useless, as we saw in the previous section. Skadron et al. proposed repairing the top-of-stack pointer and the top entry in the RAS [5]. Newer Intel processors advertise a “renamed” RSB, which I assume provides even better repair, but unfortunately I don’t know how a renamed RSB works.
Testing RAS repair
In an attempt to test the repair abilities of the RAS, the mispredicted microbenchmark from Figure 4 is modified to encourage the processor to execute many calls and returns speculatively that will then be squashed due to a pipeline flush. Like the mispredicted microbenchmark, this microbenchmark modifies the return address of the deepest RET instruction to create a return target misprediction (and pipeline flush). There are two new behaviours in this microbenchmark: Delaying the resolution of the mispredicted RET to give time for the processor to speculatively execute more instructions, and controlling what instructions are executed speculatively.
To create a delay in branch resolution, this microbenchmark inserts a data-dependent chain of 32 IMUL instructions (typically 3 cycles each, or about 96 cycles total) and makes the return address data-dependent on these multiplication operations. This delays the resolution of the (mispredicted) RET instruction, allowing many cycles for speculative instructions to be fetched and executed before the RET misprediction is detected. Note that how many instructions are actually executed speculatively may be limited by the processor microarchitecture. In the last section of this article, I observe that P6-derived microarchitectures actually do not speculate beyond one call instruction if there are multiple return instructions in flight.
To control what executes speculatively, I use the fact that the processor always uses the RAS to predict returns so the speculative execution path follows the unmodified return address. This method was inspired by retpoline [3], which uses the same mechanism to confine speculative execution to a programmer-controlled region of code (an infinite loop). For this microbenchmark, I set the speculative path to be the same as the non-speculative path, so the microbenchmark speculatively executes the same sequence of returns and calls as if there were no return misprediction. Later variations will make more use of this mechanism.
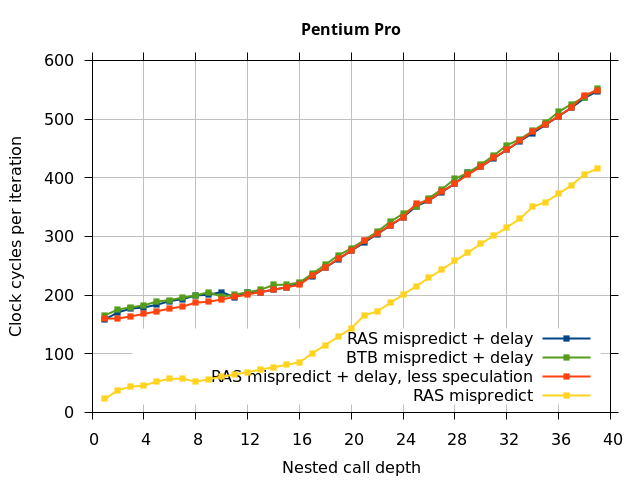
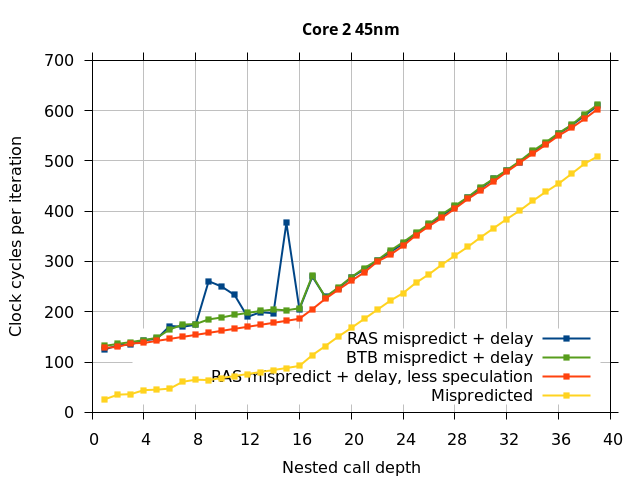
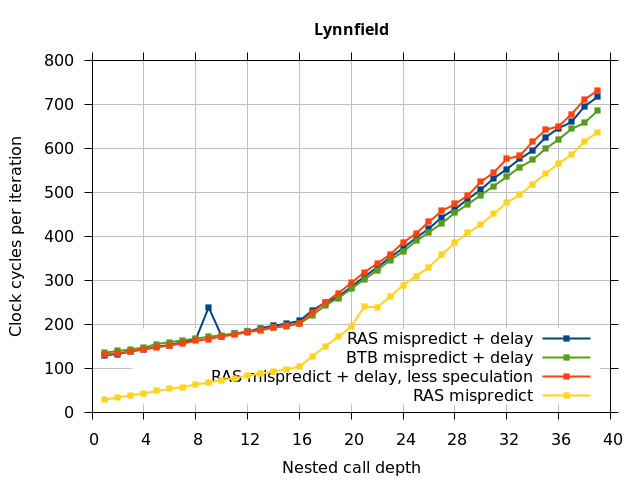
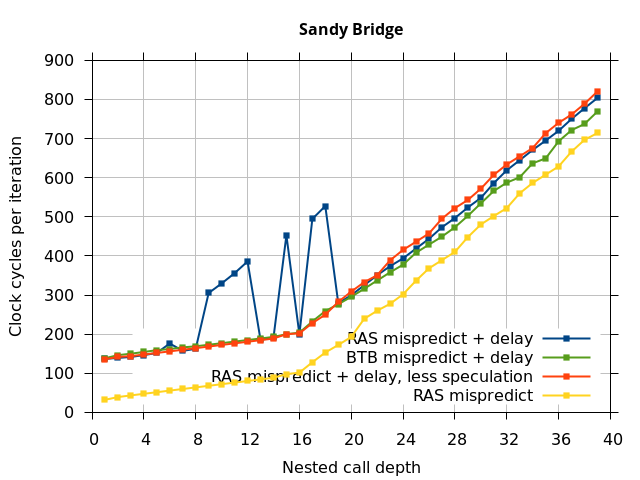
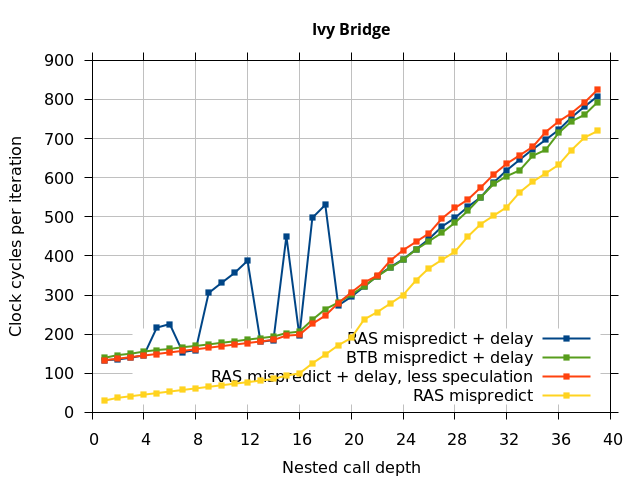
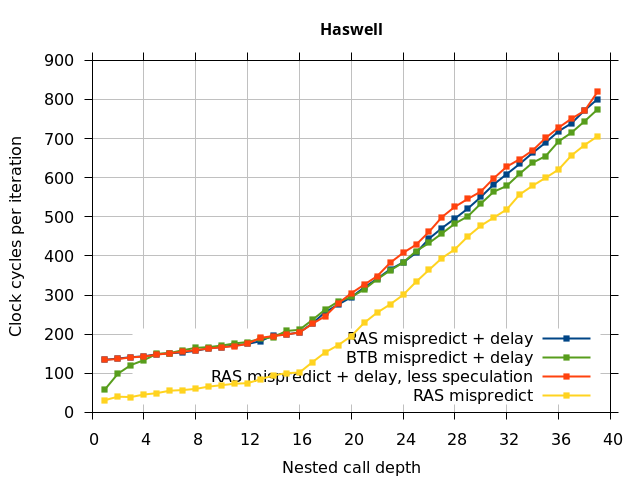
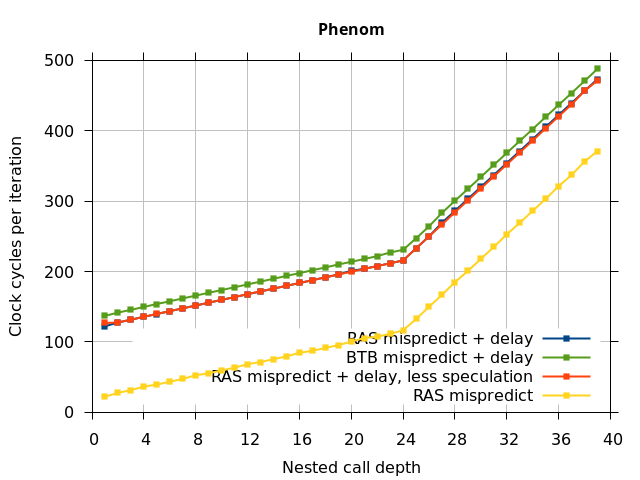
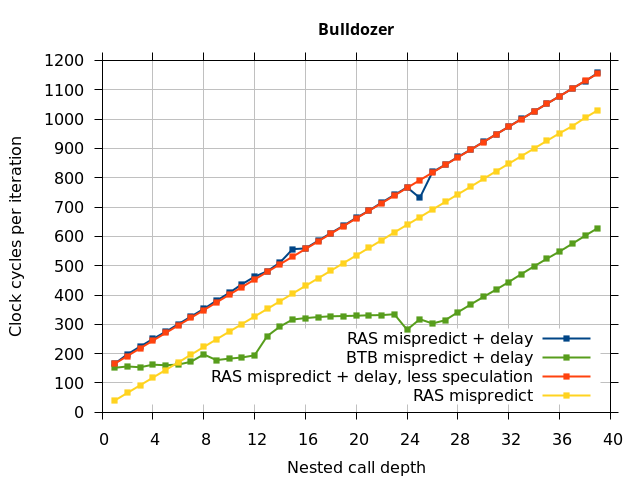
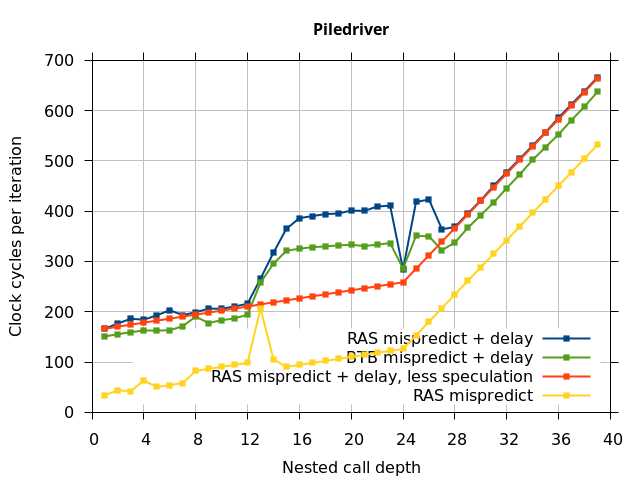
This microbenchmark is the RAS mispredict + delay series in Figure 5, below. The RAS mispredict (without delay) series from Figure 4 is plotted again for comparison.
On the Pentium Pro, for depths 2 through 10, the extra delay in resolving the mispredicted return seems to cost about 10 clock cycles, which might be interpreted as roughly one extra branch misprediction, but it is hard to be certain it is not something else. Sandy Bridge and Ivy Bridge show some spikes that are large enough to look like misalignment (later tests confirm that the top of stack is indeed sometimes incorrectly repaired). On Bulldozer, a single return misprediction causes a misalignment anyway, so adding a delay revealed no new information. On Piledriver, there is significant extra delay for depths 12 through 26. However, the slope of the region from 16 to 26 matches the slope in the region of RAS prediction hits, which suggests that this extra delay is caused by a different mechanism than a simple RAS misalignment.
Pentium Pro
Core 2 45nm
Lynnfield
Sandy Bridge
Ivy Bridge
Haswell
Phenom
Phenom II

Bulldozer
Piledriver
Microbenchmark diagram
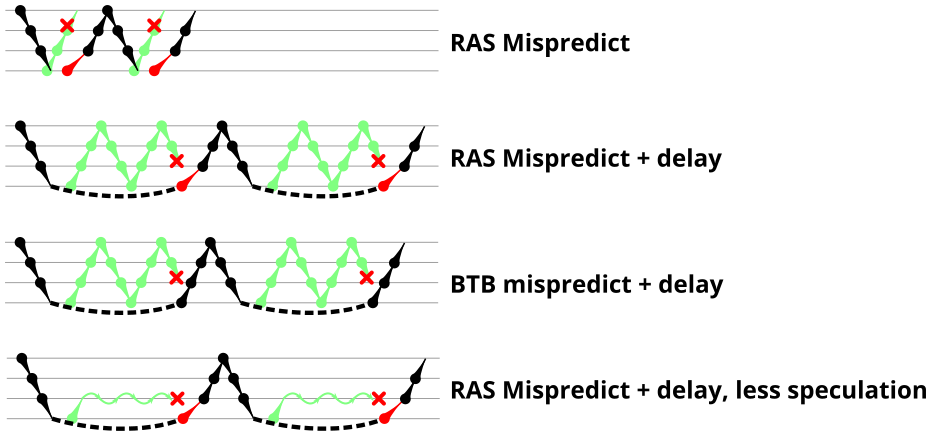
The above microbenchmark triggered some imperfect RAS repair by using 1. a sequence of returns and calls executed speculatively, and 2. a mispredicted return. Which of these two are required? The following two experiments will attempt to separate this, by 1. preventing a long sequence of speculative returns and calls, or 2. causing the pipeline flush using a mispredicted indirect branch instead of a mispredicted return.
Speculative returns and calls disrupt RAS state
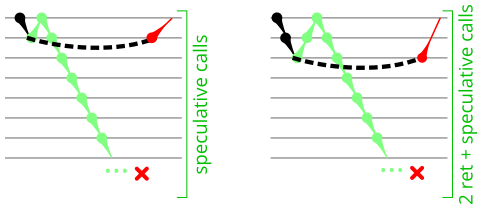
This variation of the microbenchmark performs the same operations as the previous microbenchmark, except that the instructions that are speculatively executed after the mispredicted return is a single return followed by an infinite loop. This reduces the number of speculative returns to 1 and speculative calls to 0. Note that we have independent control over the speculative and non-speculative execution paths, and in this microbenchmark, these are now different. The results of this experiment are shown in the RAS Mispredict + delay, less speculation series in Figure 5.
In all of the microarchitectures tested (except Bulldozer), none of the extra delay (clobbered RAS entries or misaligned RAS) occurred once most of the speculative execution of returns and calls is removed. This indicates that in most processors, it is the speculative calls and returns that disrupt the RAS state, and a pipeline flush caused by a mispredicted return is not sufficient.
Return misprediction is more damaging than indirect branch misprediction
I repeated the previous microbenchmark, but with the pipeline flush caused by a mispredicted indirect branch instead of a mispredicted return. This is plotted as BTB Mispredict + delay in Figure 5. Interestingly, the cause of the pipeline flush sometimes impacts how well the RAS is repaired. On Intel microarchitectures, an indirect branch misprediction does not cause the occasional RAS misalignment that a return misprediction causes, even when speculative calls and returns are executed. Similarly, for Bulldozer, an indirect branch misprediction does not cause RAS misalignment. However, on Piledriver (and Bulldozer), the unusual delays (between depth 12 and 26) still occur, indicating that the mechanism that causes these delays is caused by speculative exceution of calls and returns in general, and is not dependent on a return misprediction.
In summary, all of the tested Intel processors and the two Phenom processors all seem to repair the RAS well after a simple pipeline flush, but Sandy Bridge and Ivy Bridge occasionally seem to recover the top-of-stack pointer incorrectly when the pipeline flush is caused by a return misprediction. The AMD Bulldozer and Piledriver processors do not completely repair the RAS after a pipeline flush, and Bulldozer incorrectly repairs the top-of-stack pointer after a return misprediction. Except for Bulldozer, disruption to the RAS entries or pointer only occurs if there were call instructions executed speculatively.
Detecting RAS misalignment
In the previous section, I discovered several imperfections in RAS repair after pipeline flushes. There are two main ways the RAS state can be disrupted: Entries in the RAS can be clobbered, or the RAS entries themselves could be correct but the RAS top-of-stack (TOS) pointer becomes incorrect so the wrong RAS entry is used for prediction. This section adds yet another variation of the microbenchmark to try to detect RAS top-of-stack pointer misalignment, the amount of misalignment, and distinguishing misalignment from other types of RAS corruption.
Normally, a sequence of correctly-matched calls and returns results in correct branch predictions, while a misaligned TOS pointer results in no correct predictions. However, if the processor (incorrectly) misaligns the TOS, a microbenchmark could deliberately misalign its calls and returns to cancel out the misalignment. The RAS would then be realigned (or “un-misaligned”) and see correct return predictions. Conversely, clobbered RAS entries cannot be repaired this way because the entries themselves are incorrect (this is particularly true in this microbenchmark because the calls used for clobbering is from a different region of code than the calls used for timing measurement). Thus, this technique can detect some cases of TOS misalignment, at least if the TOS misalignment is not combined with other forms of RAS corruption.
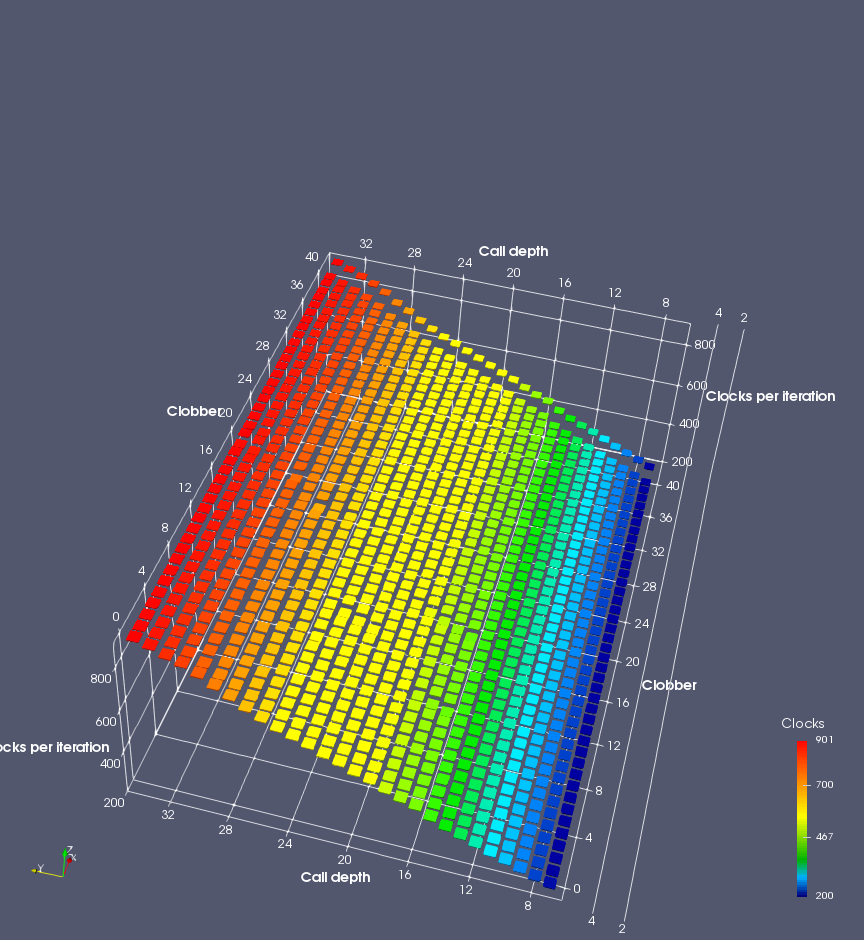
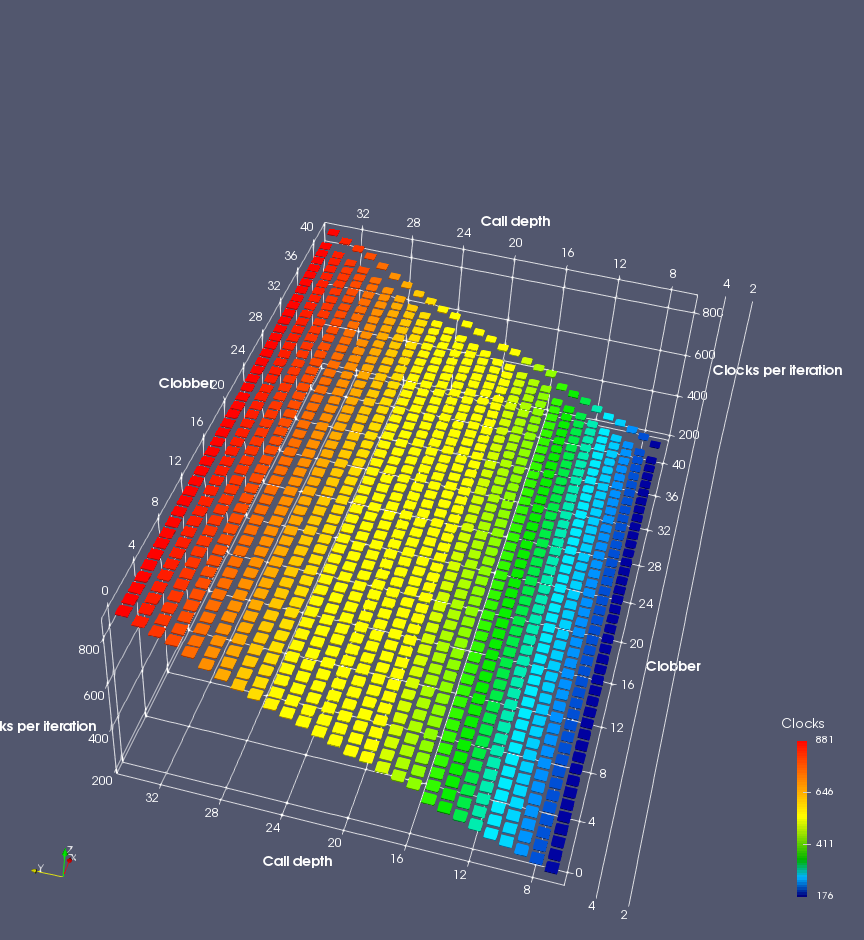
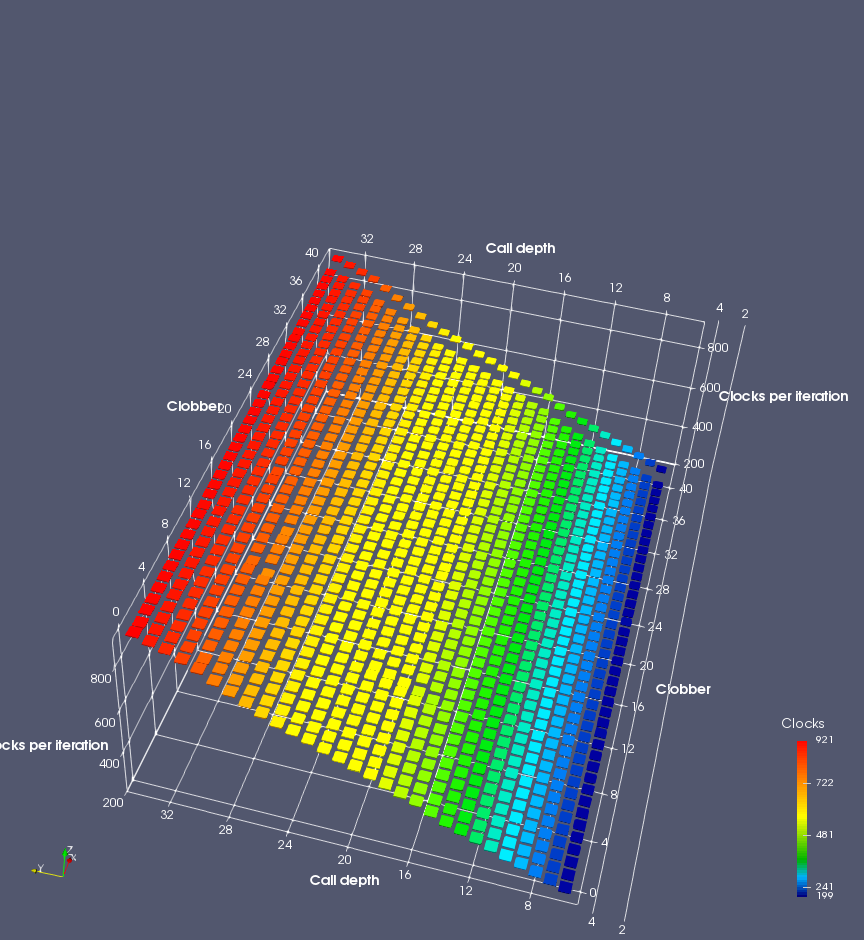
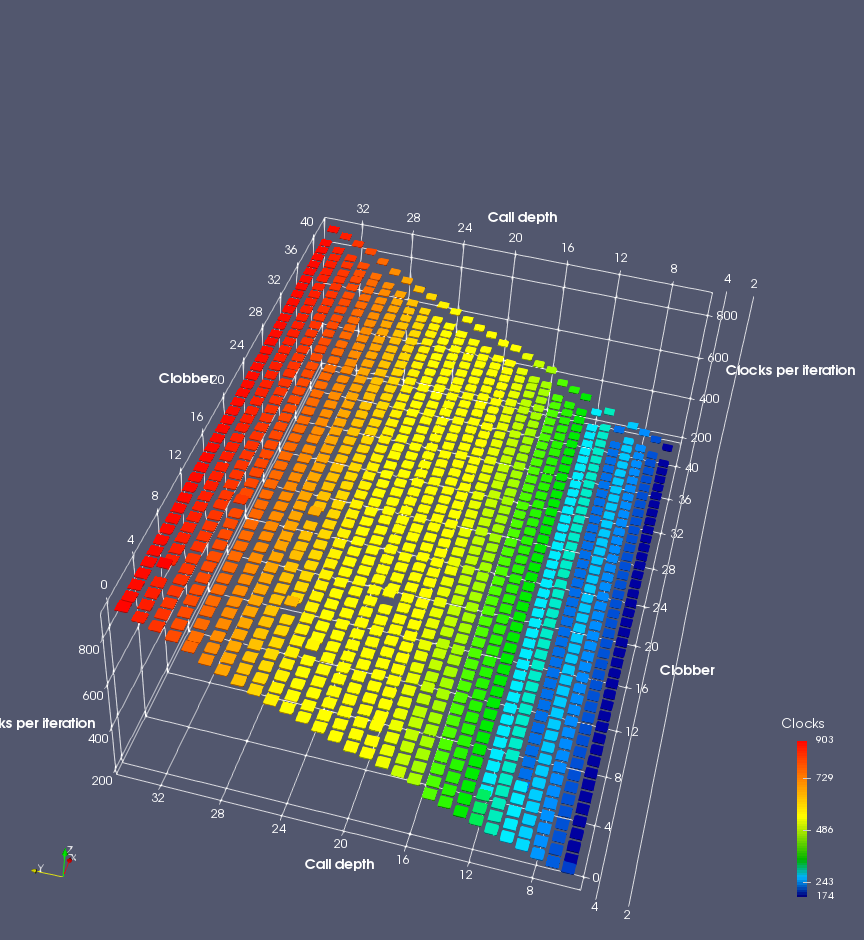
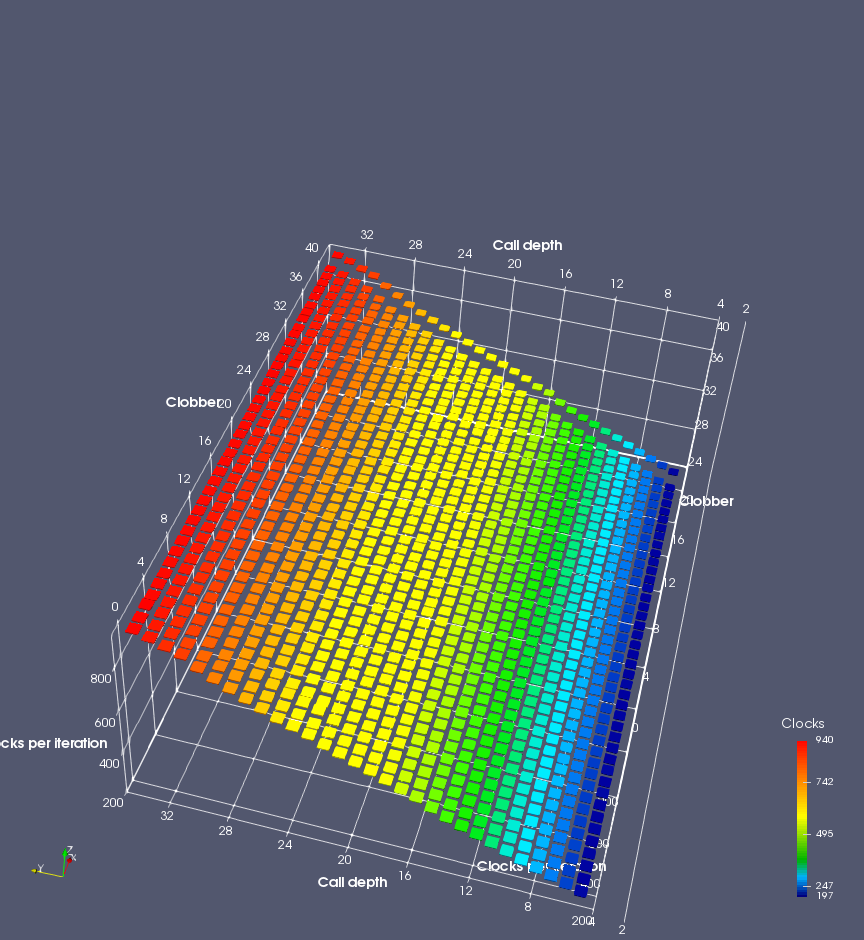
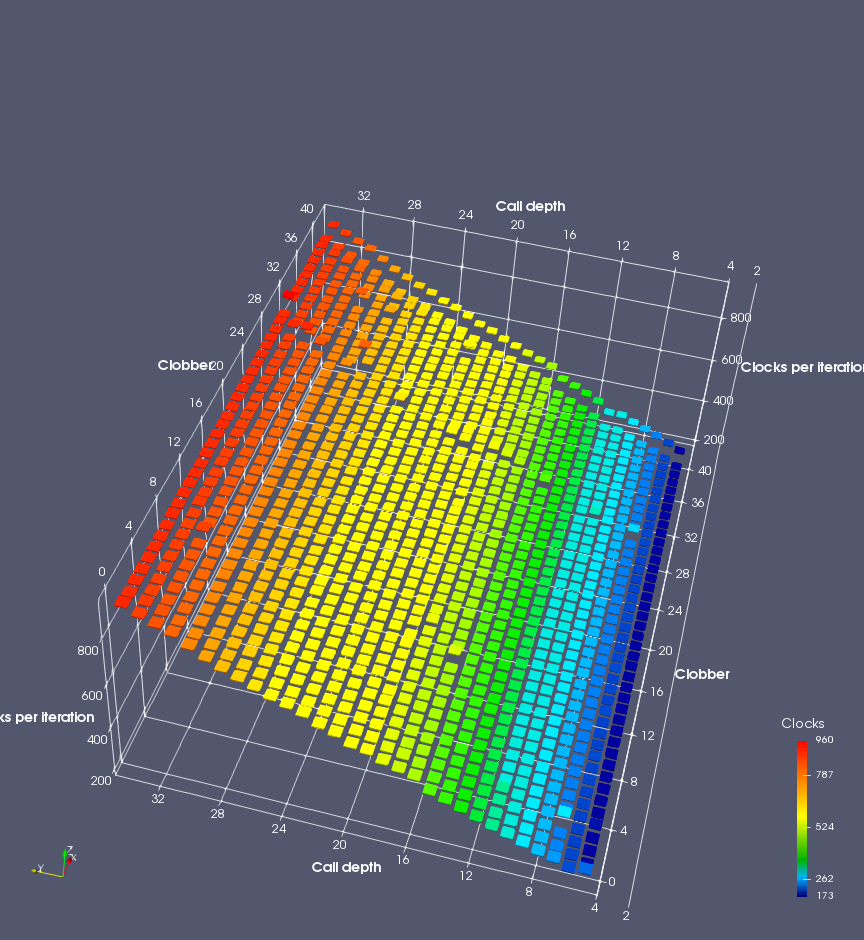
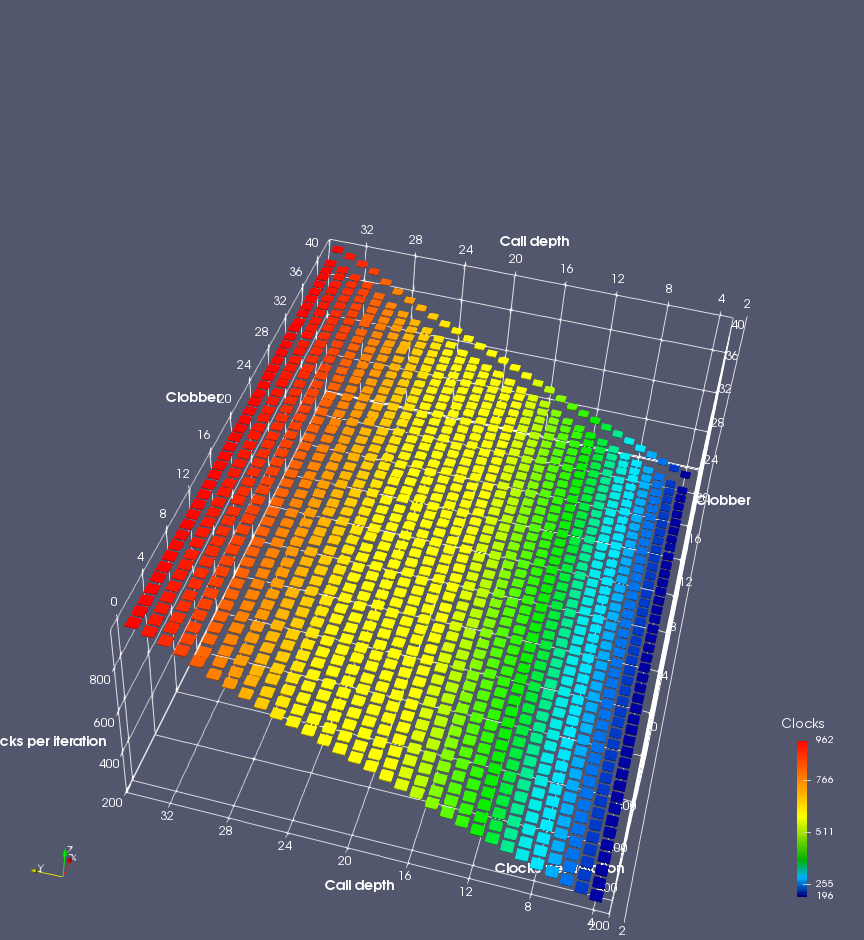
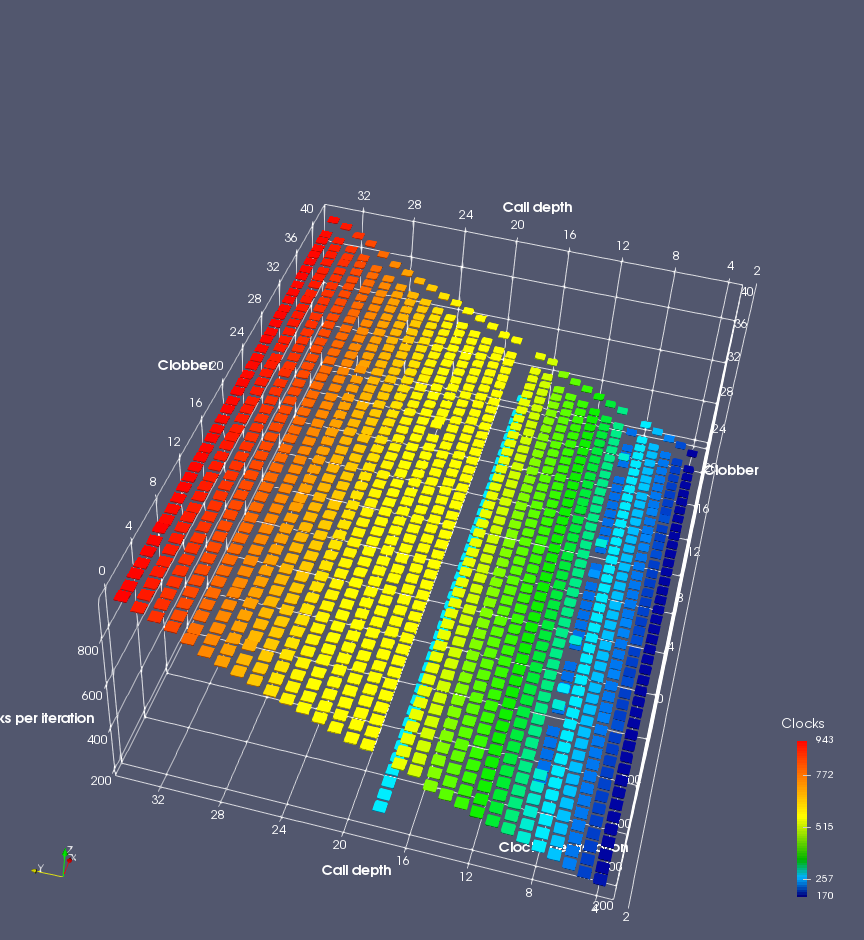
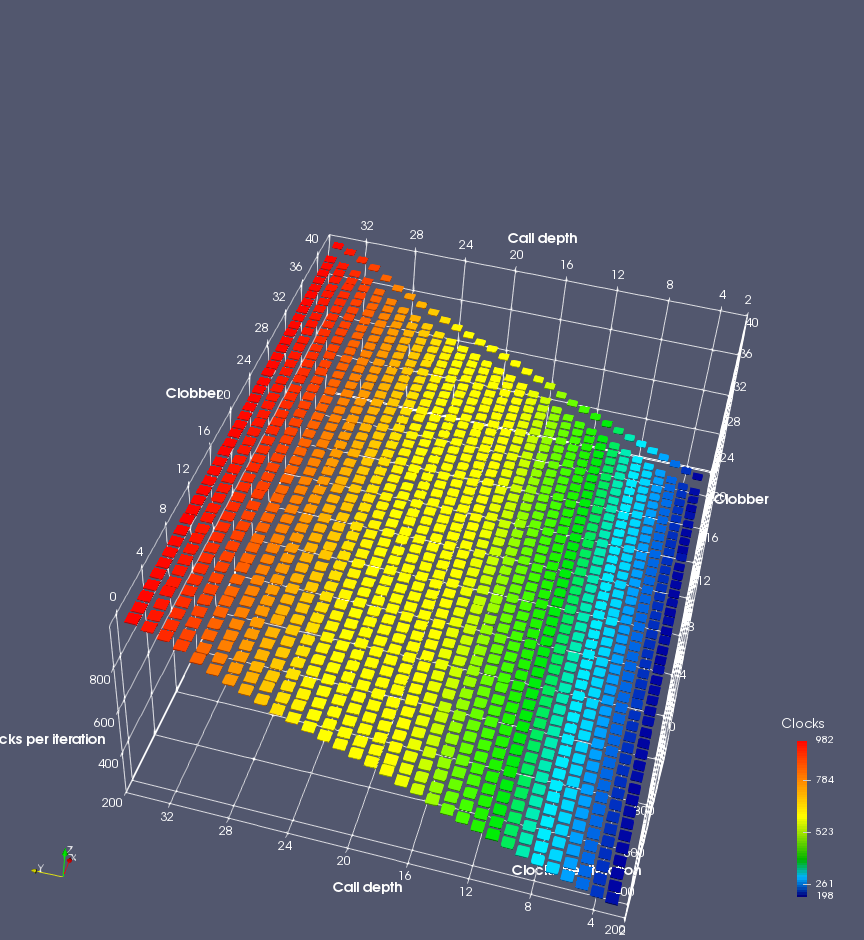
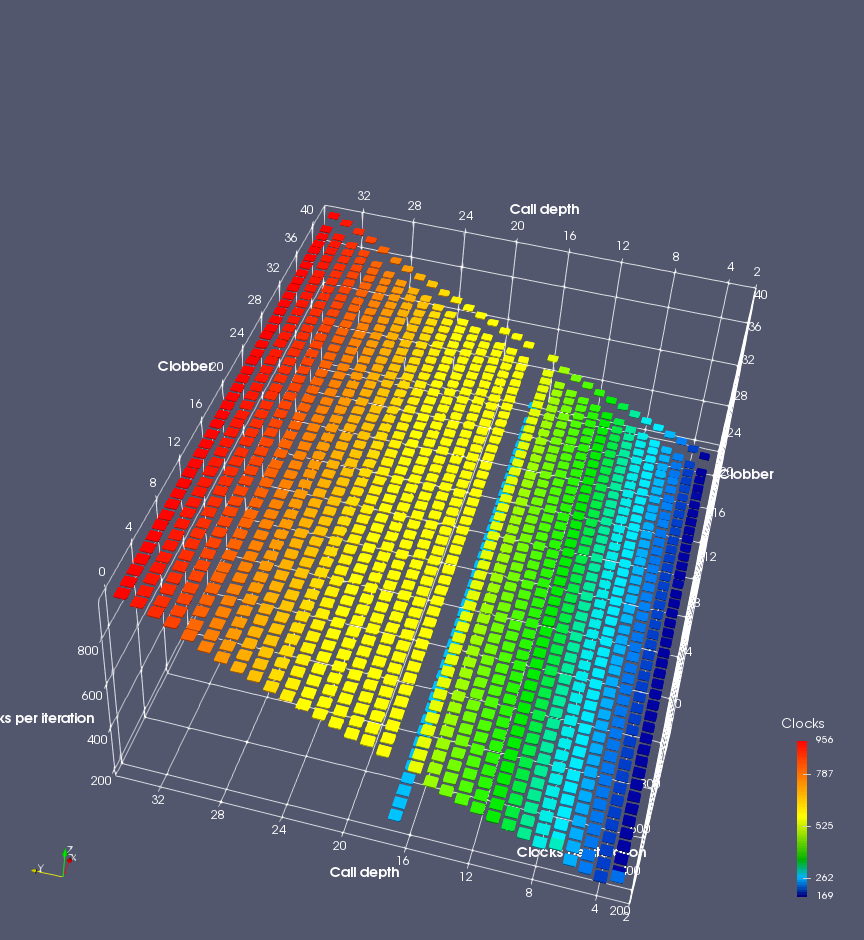
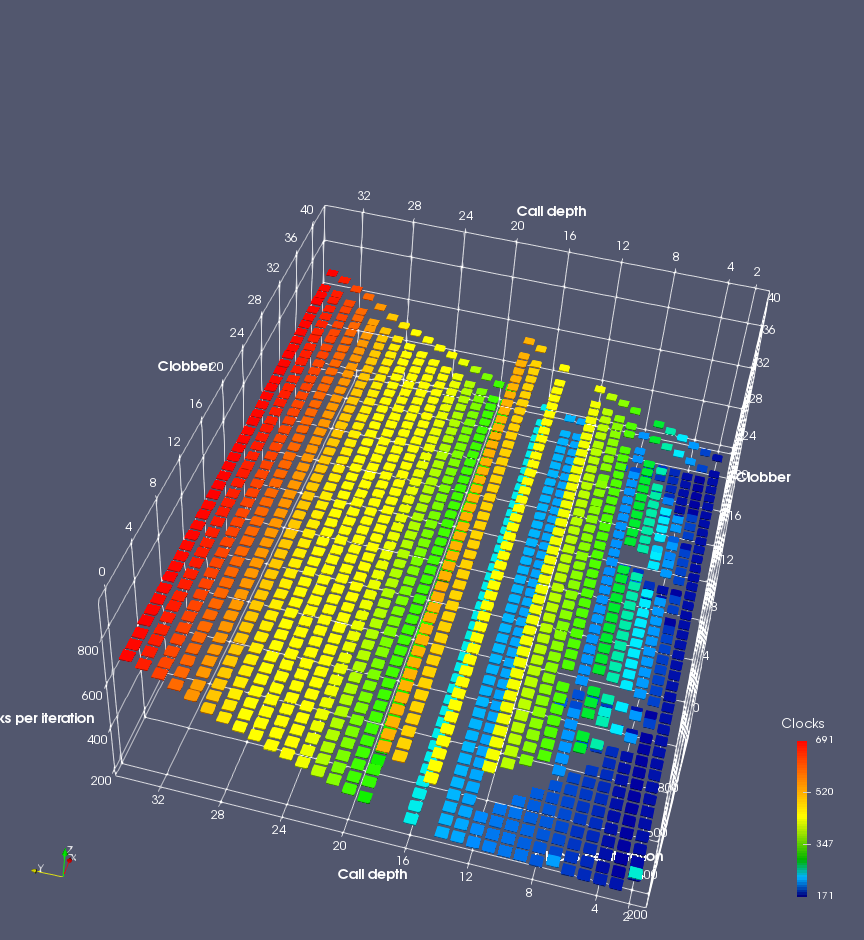
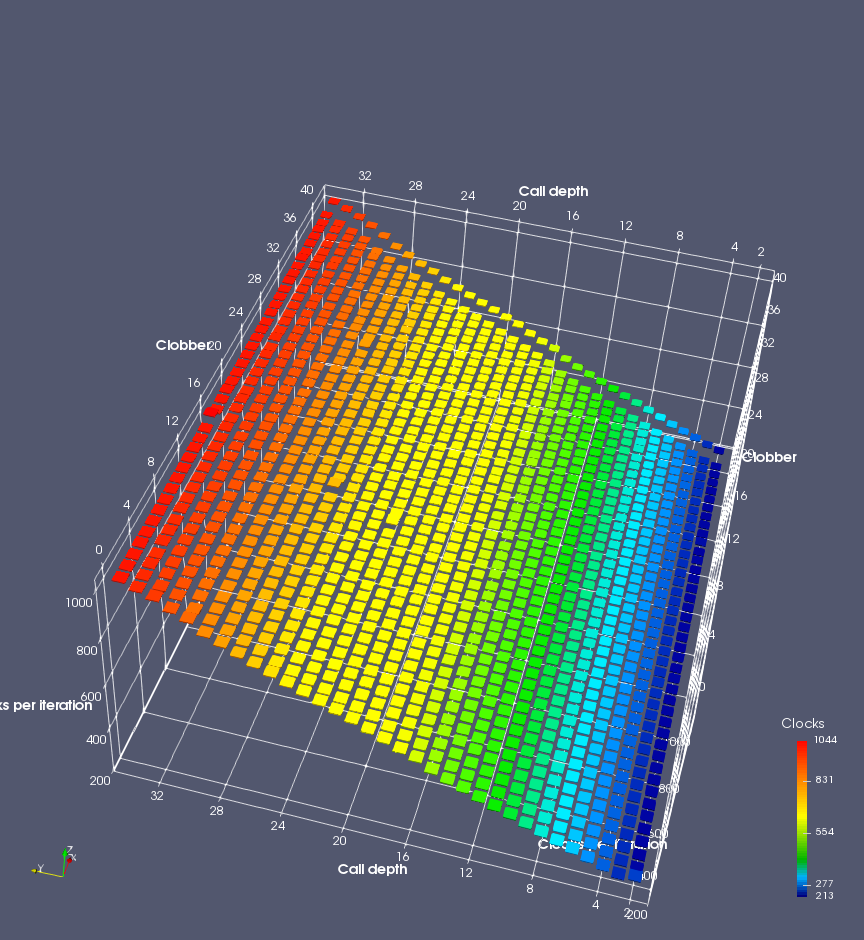
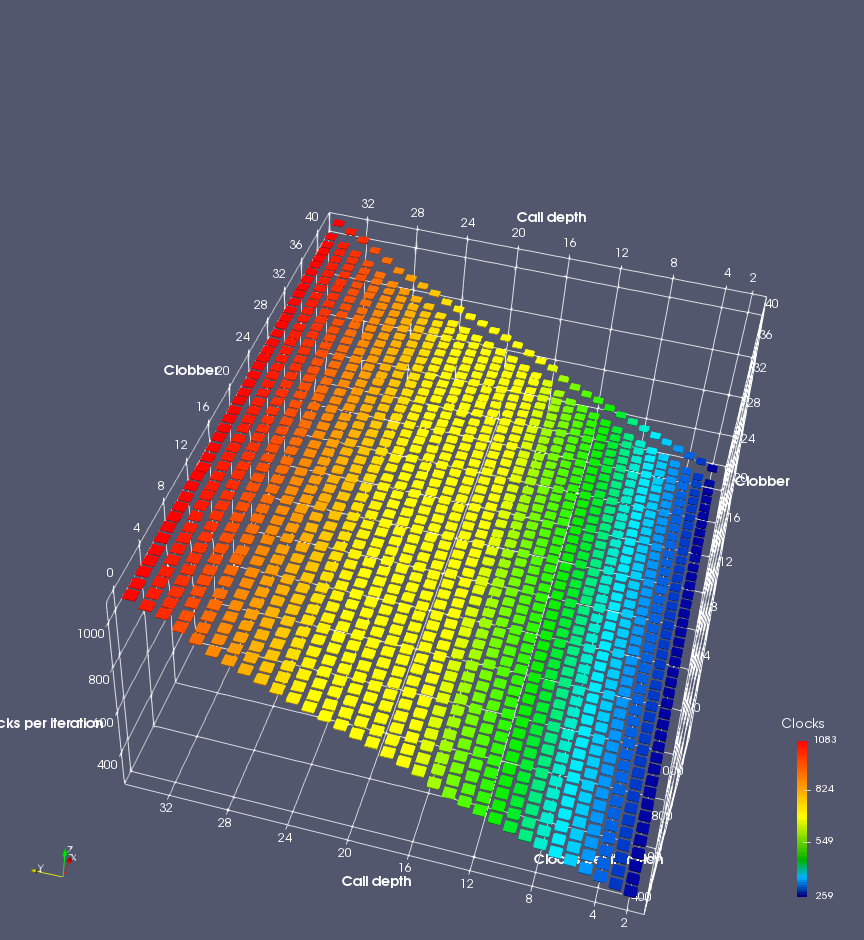
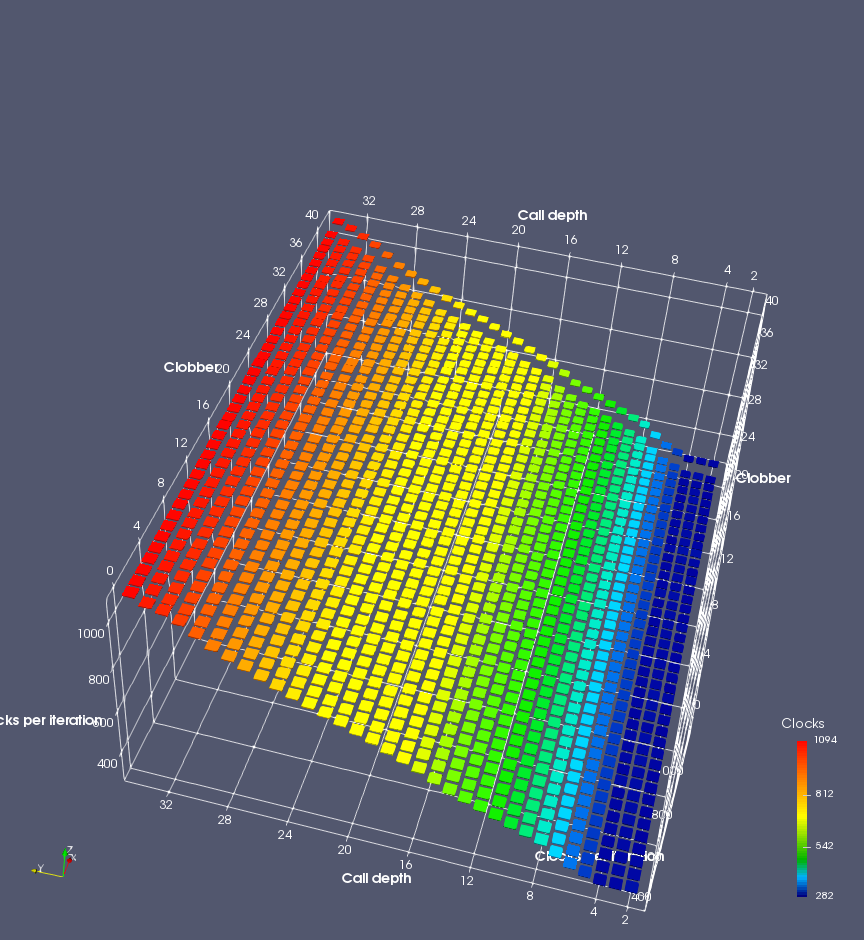
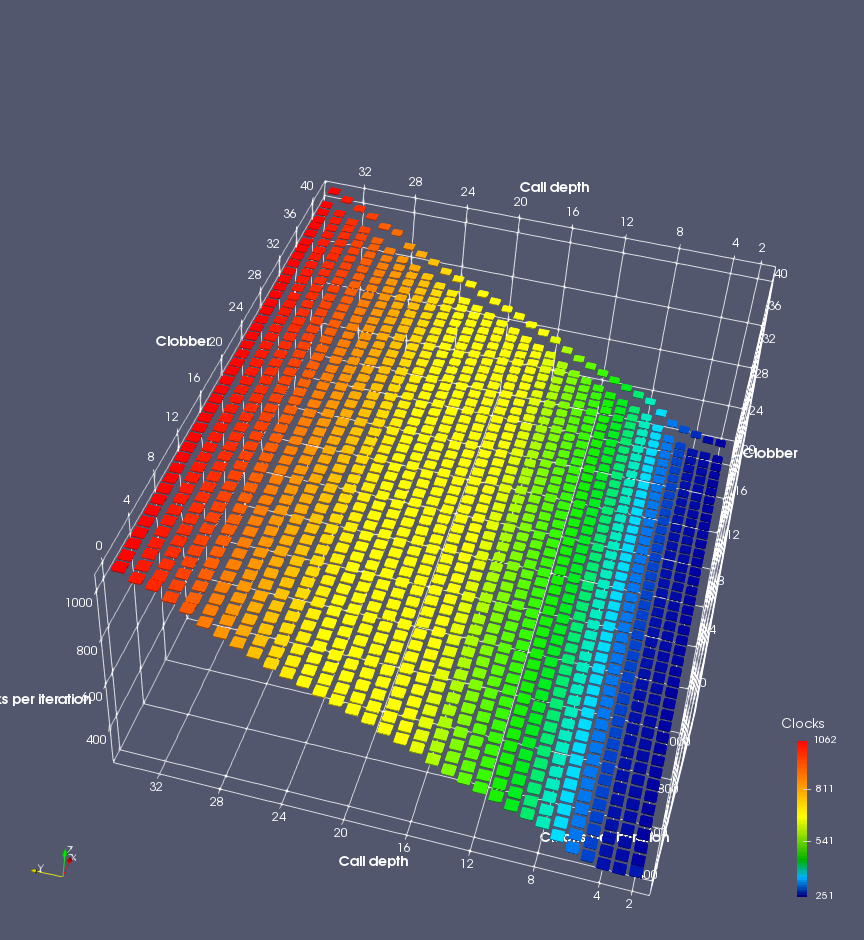
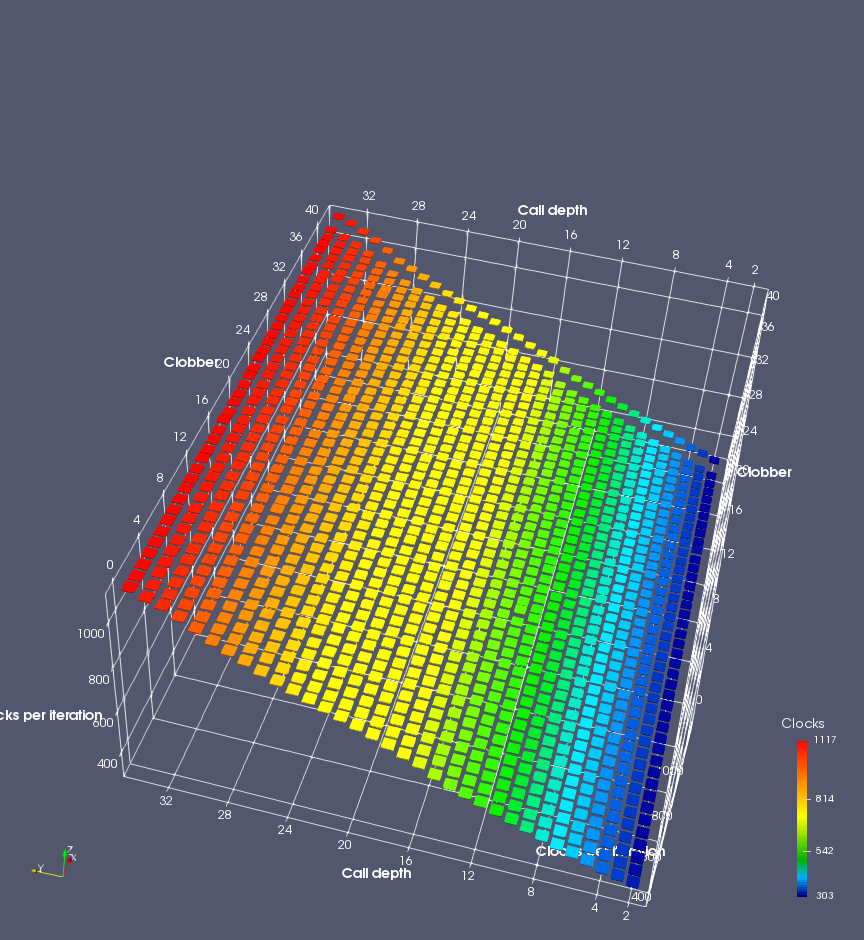
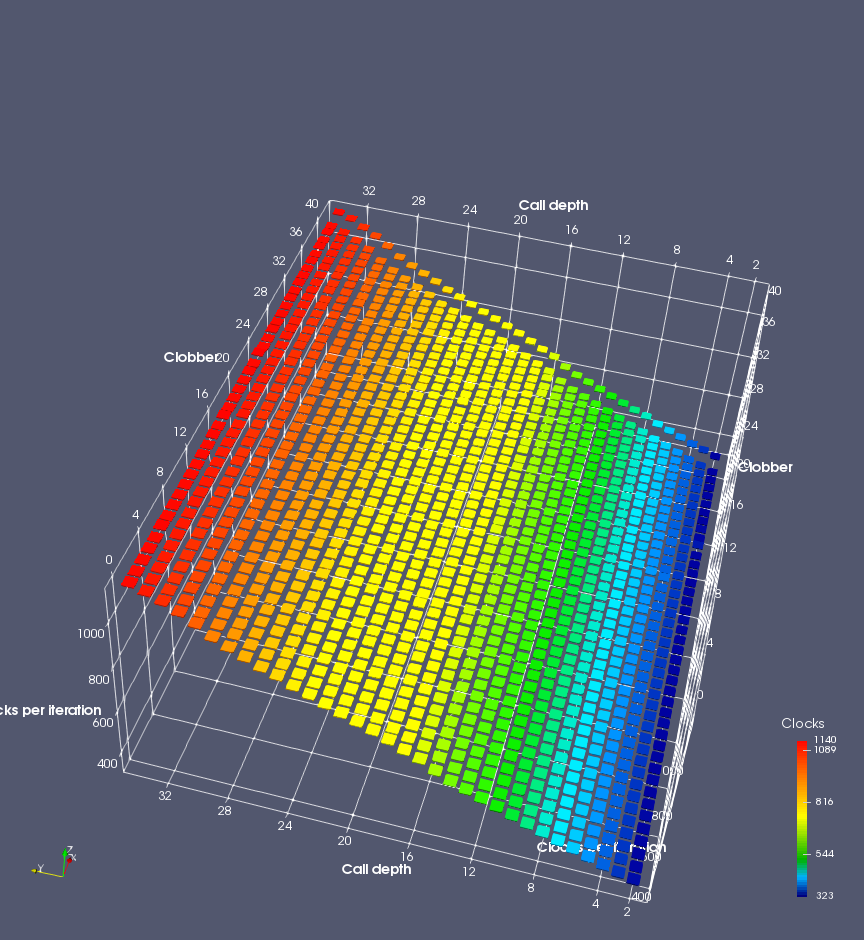
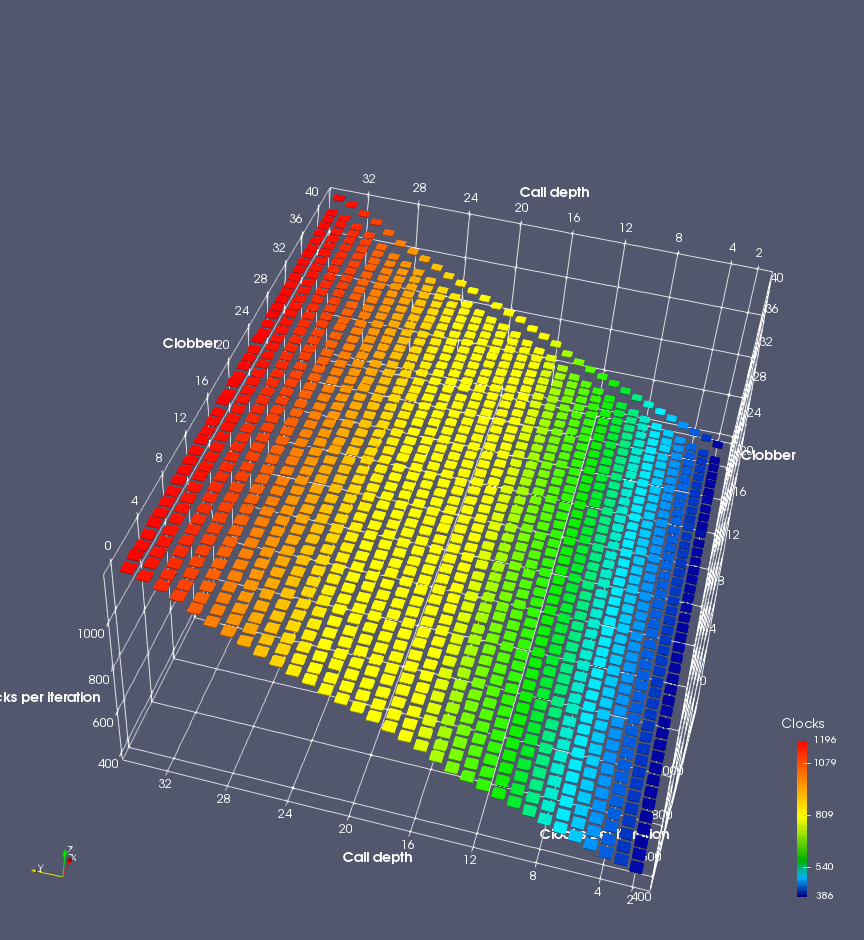
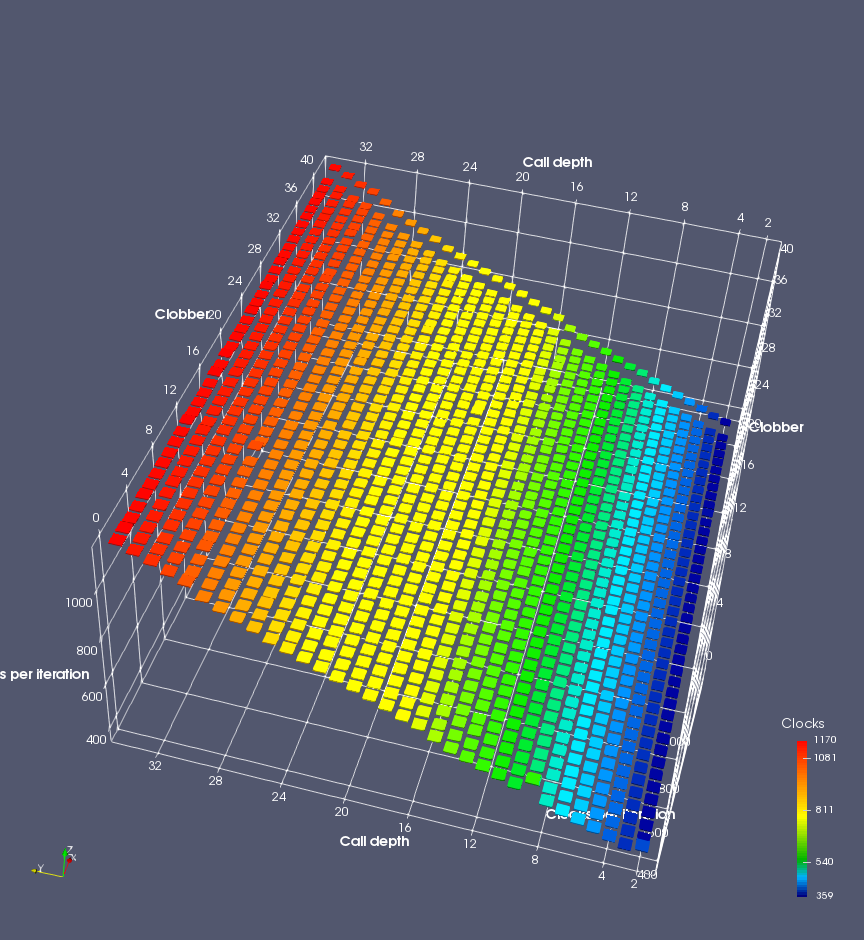
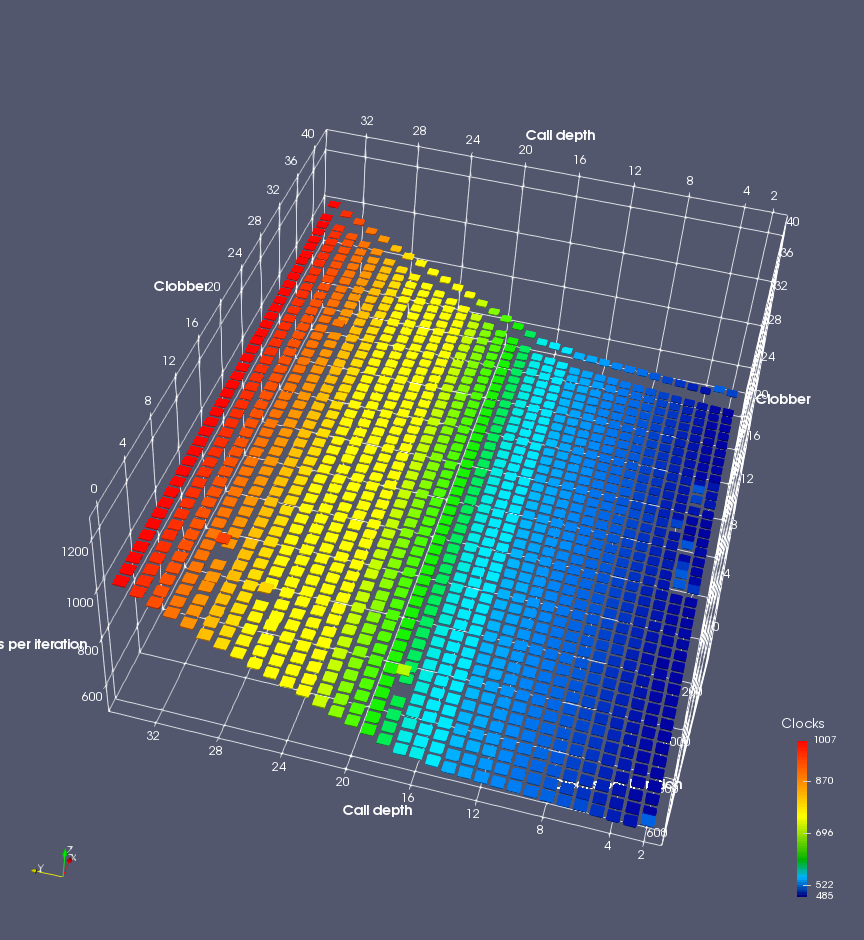
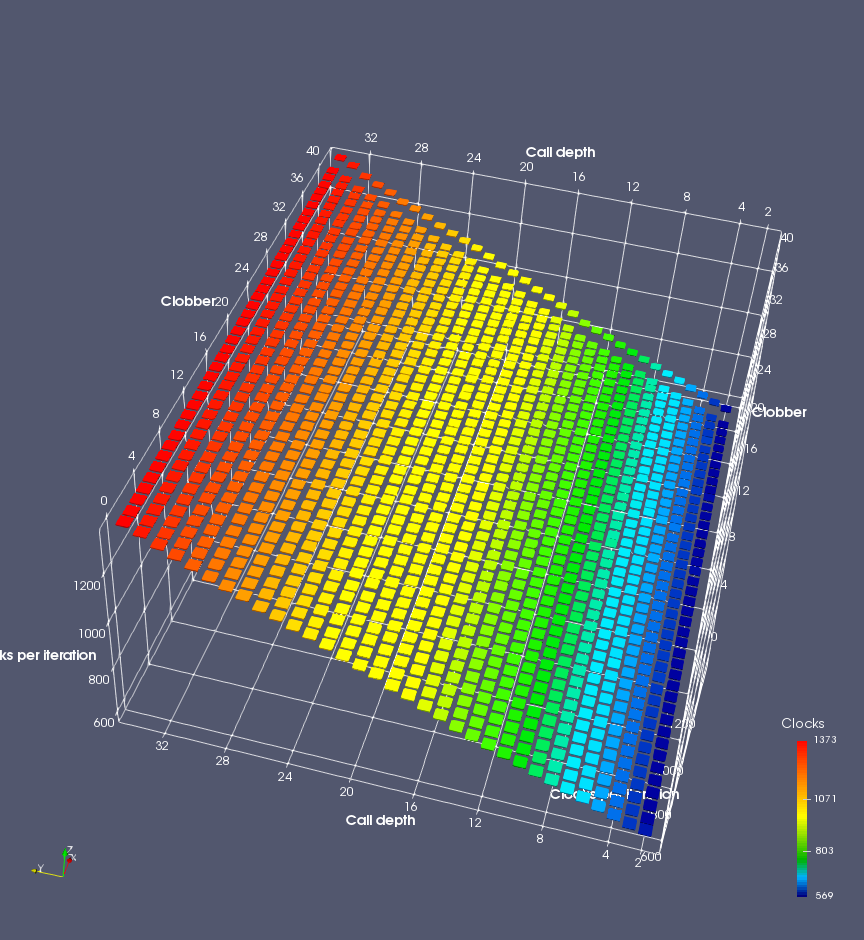
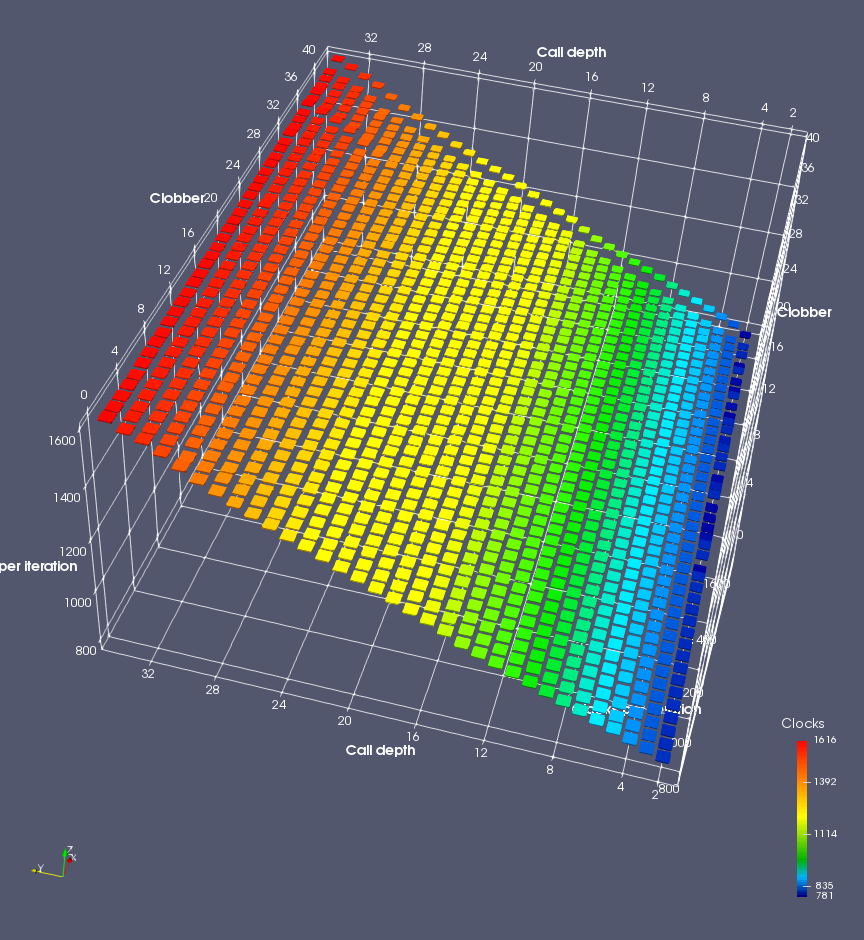
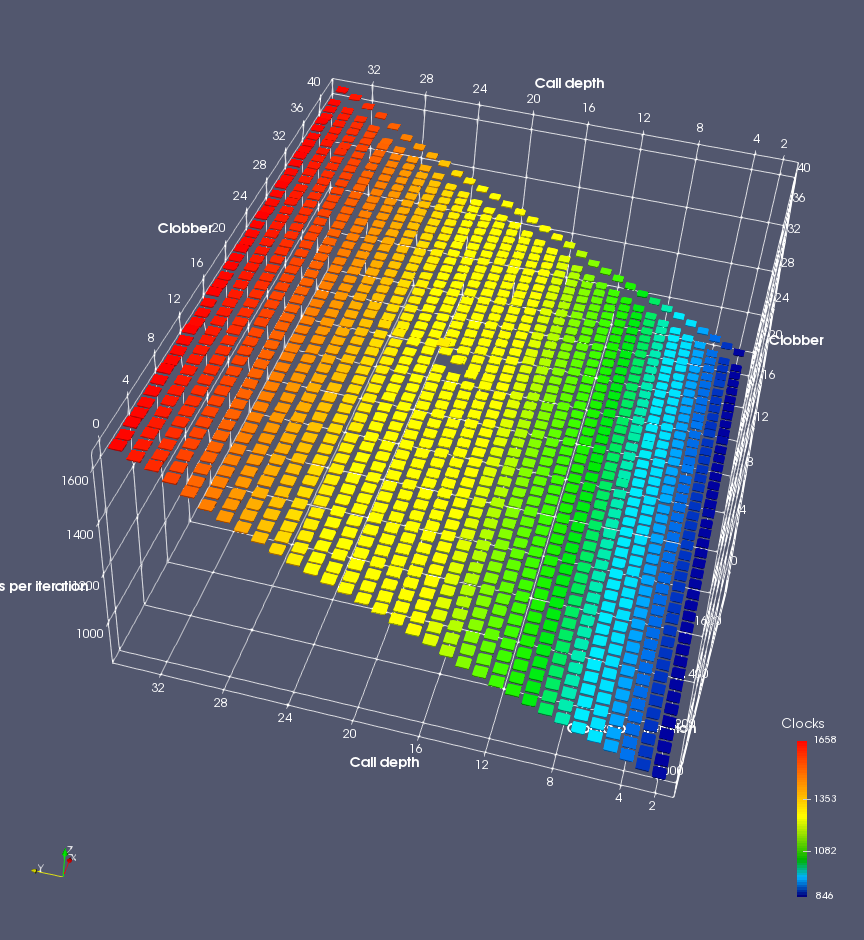
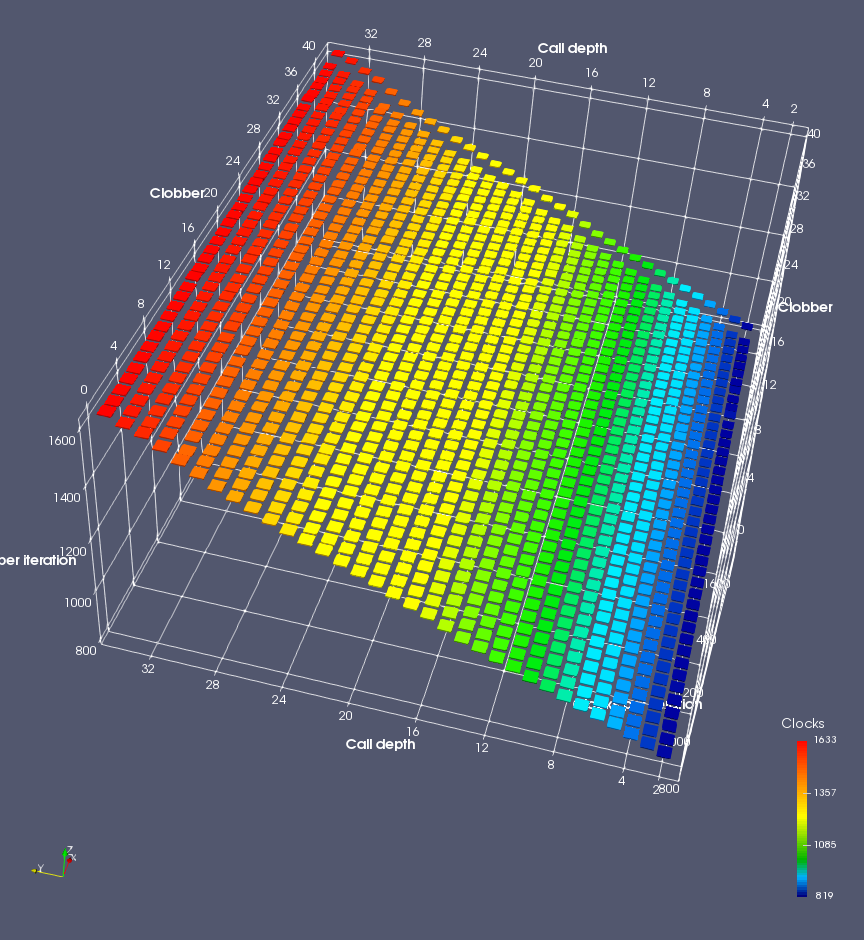
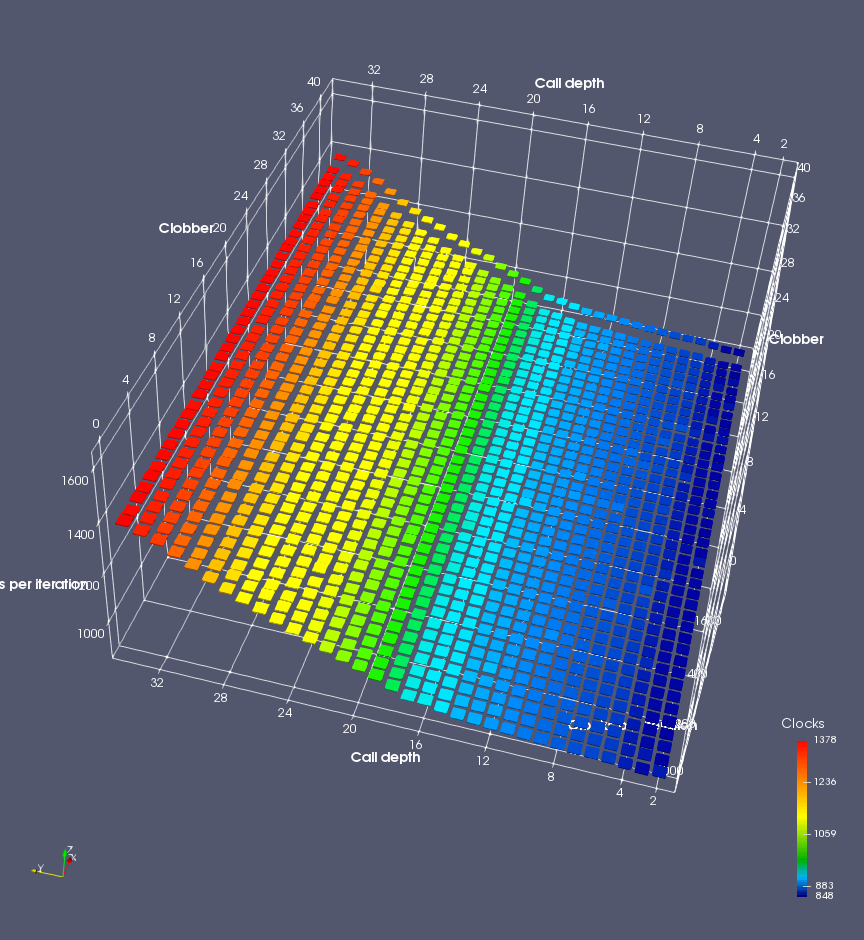
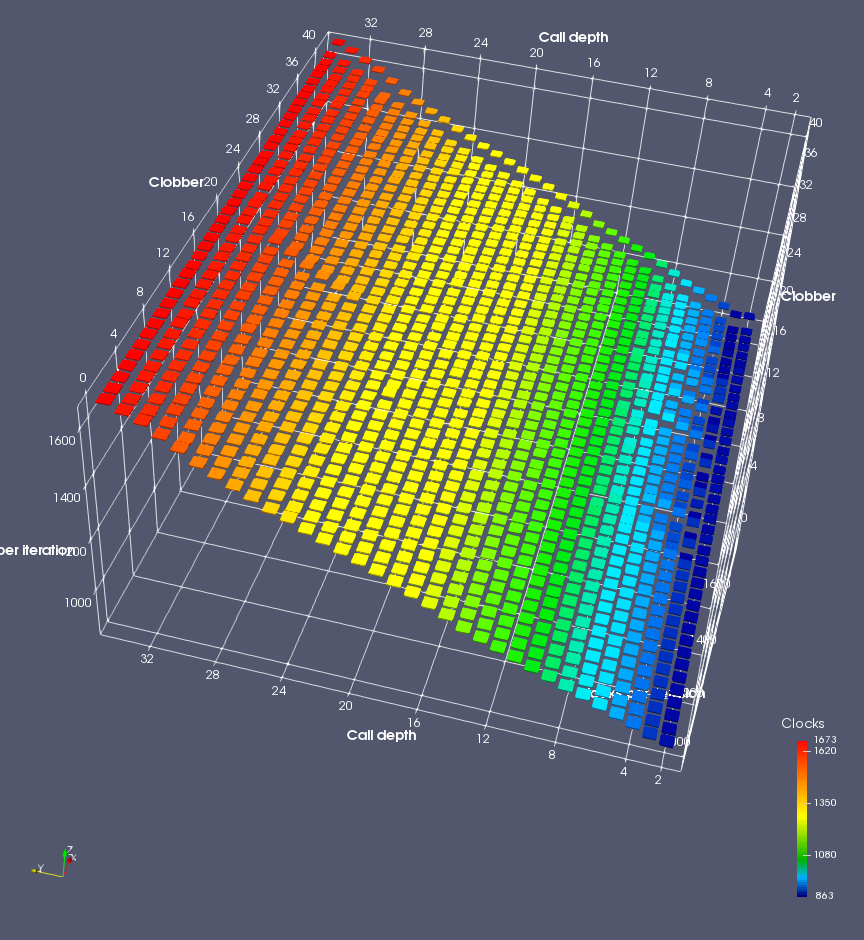
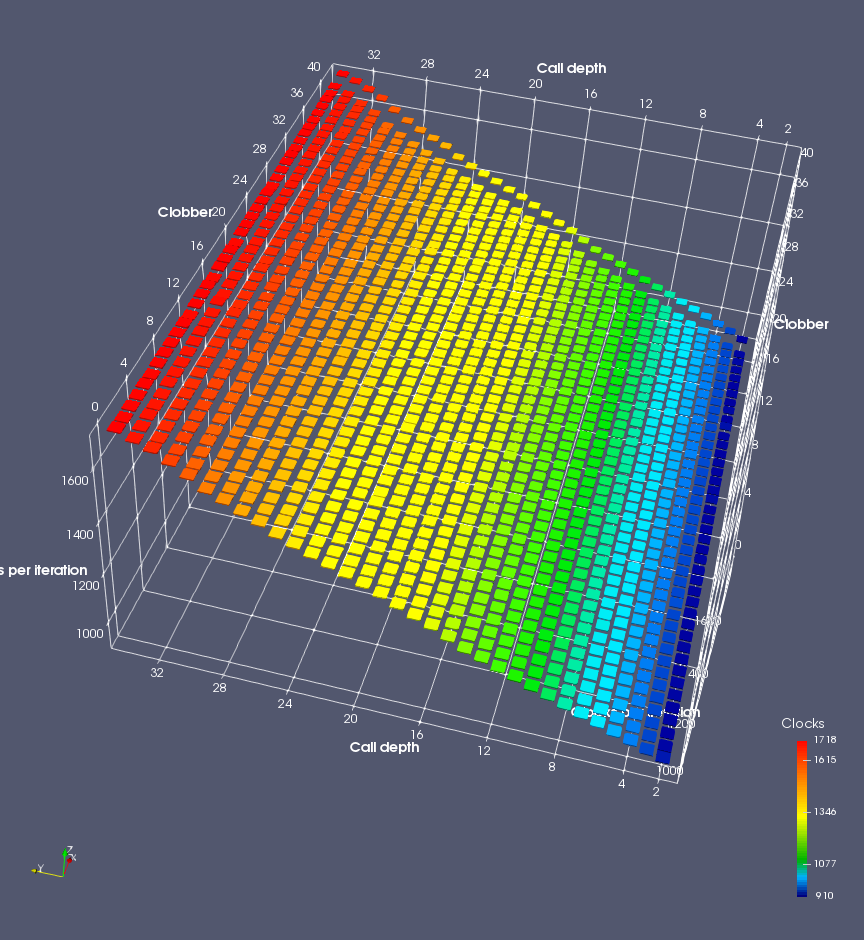
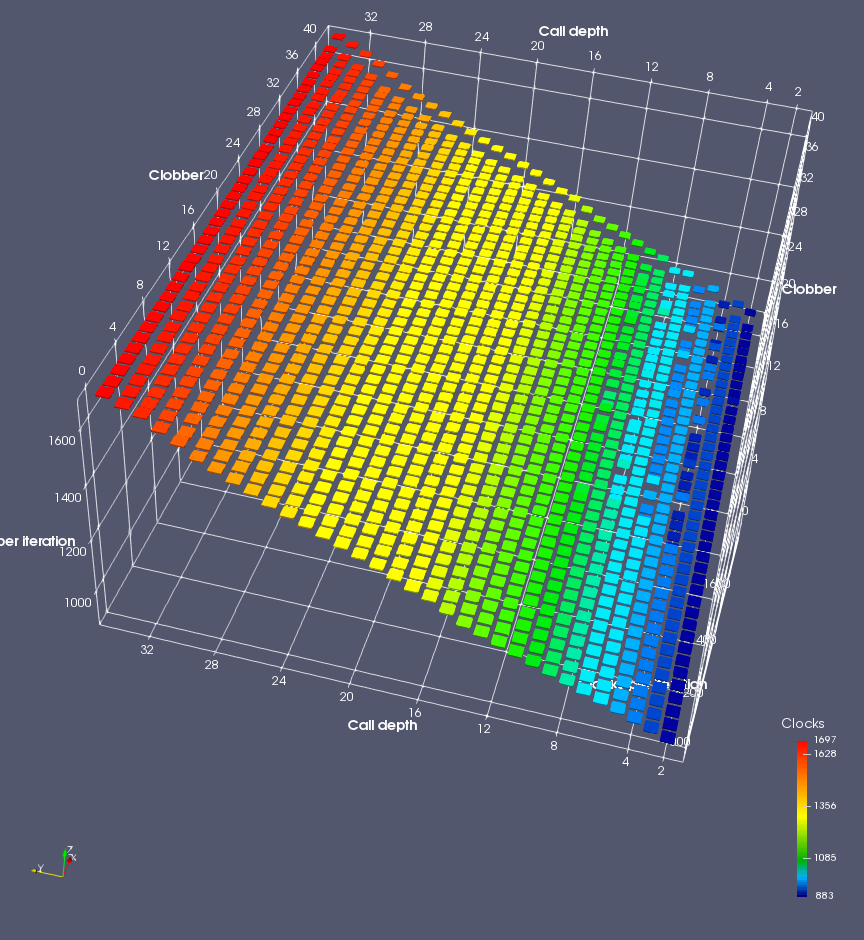
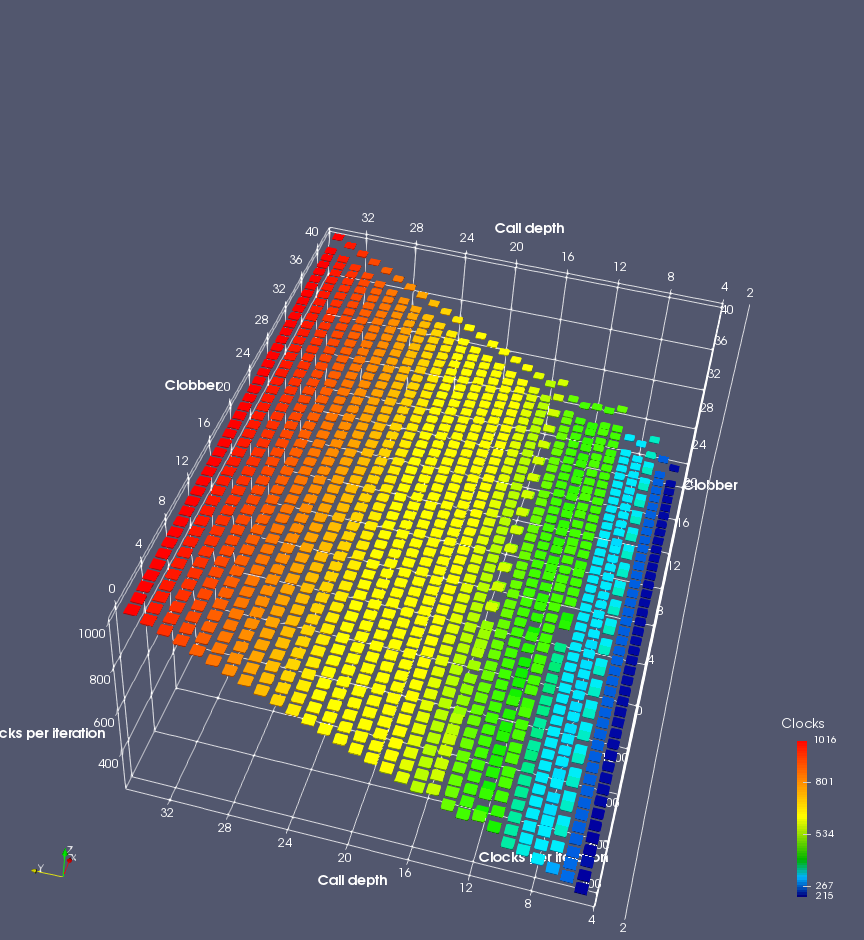
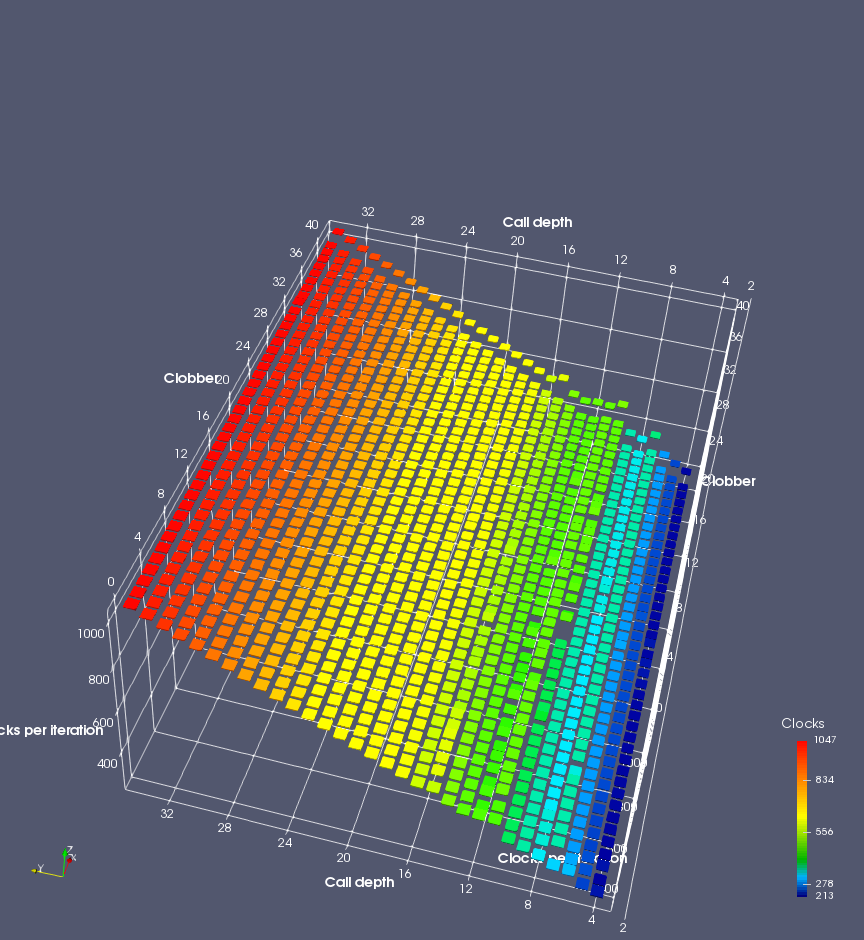
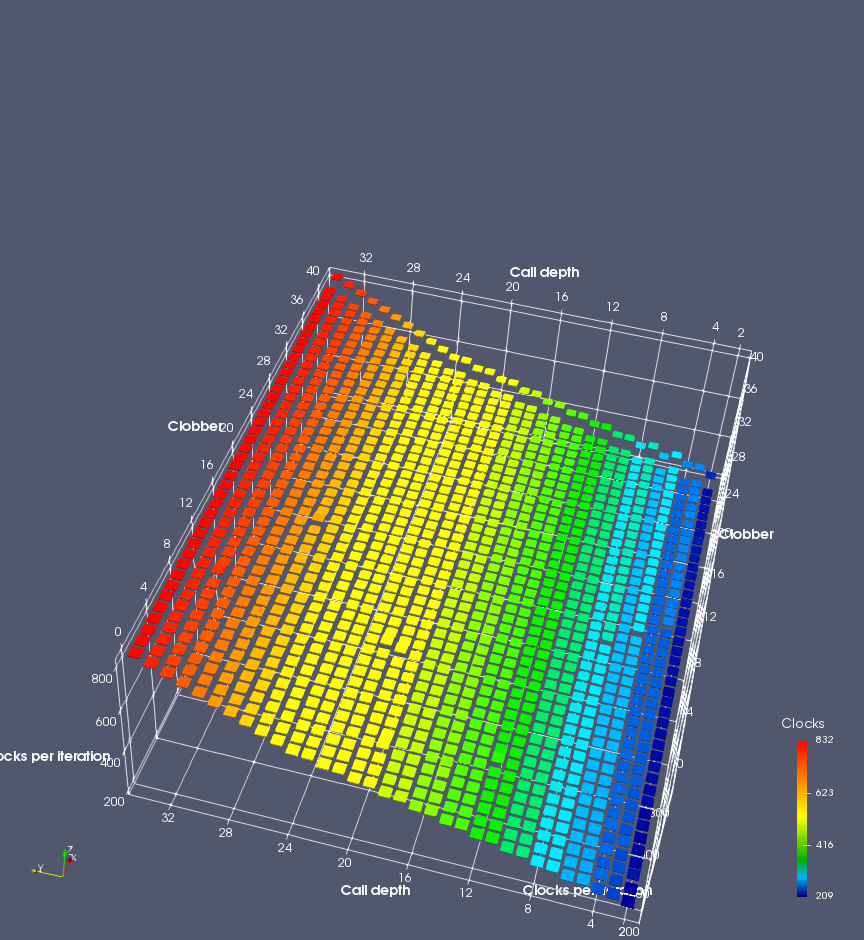
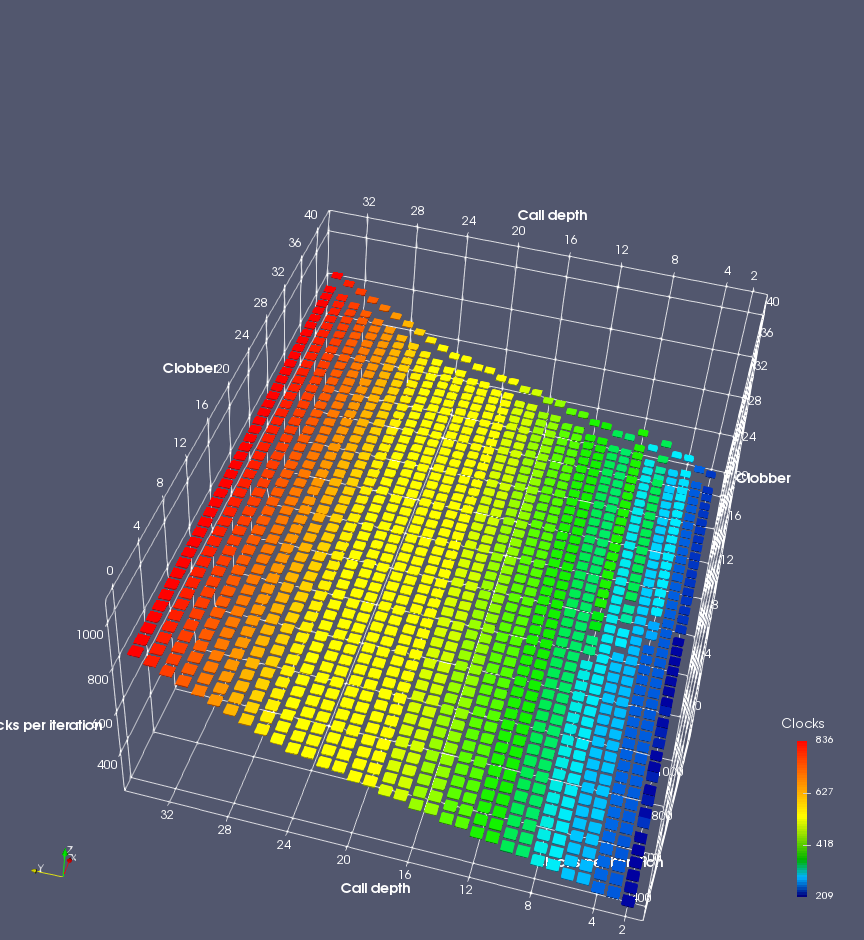
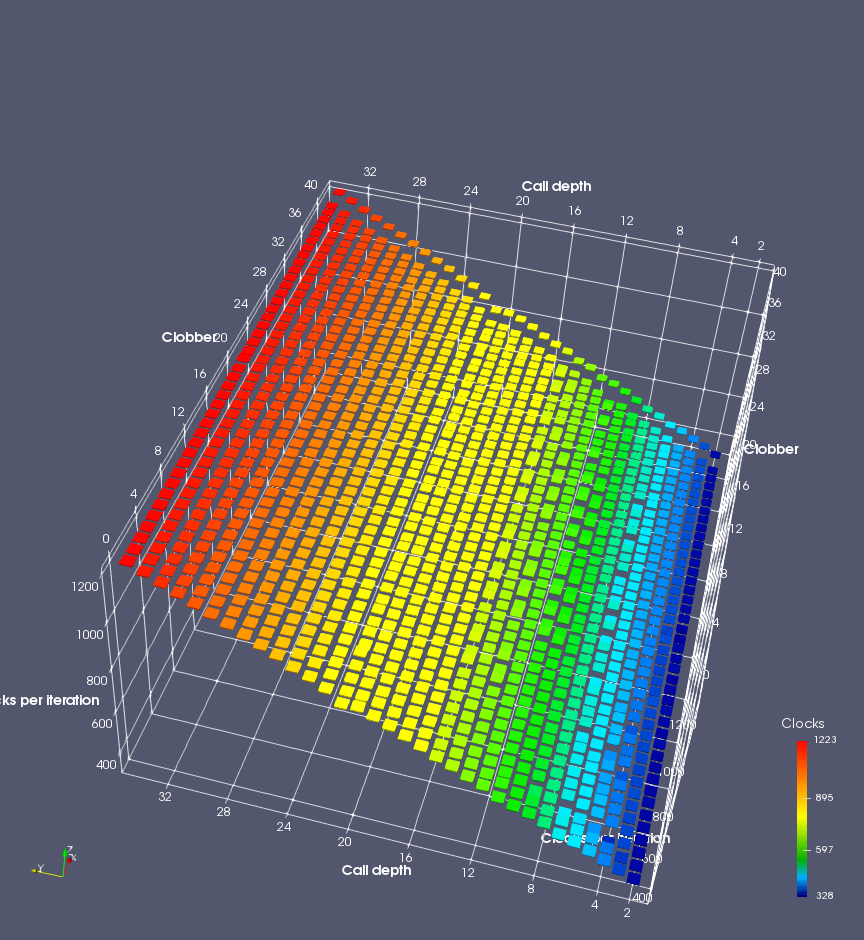
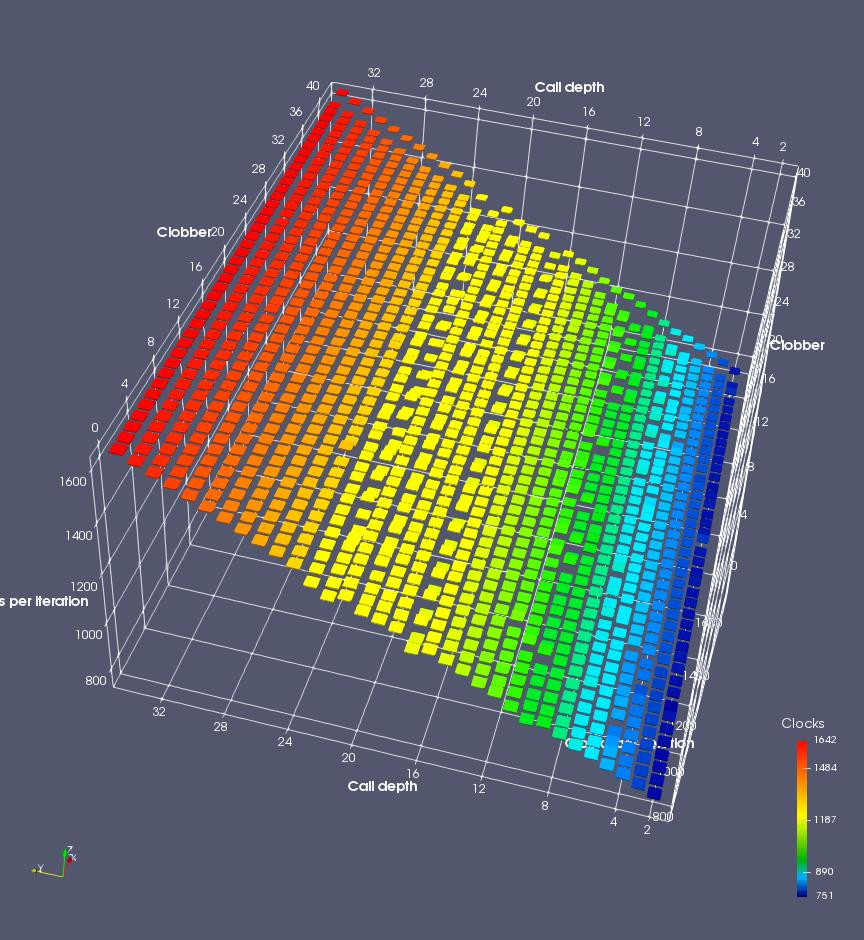
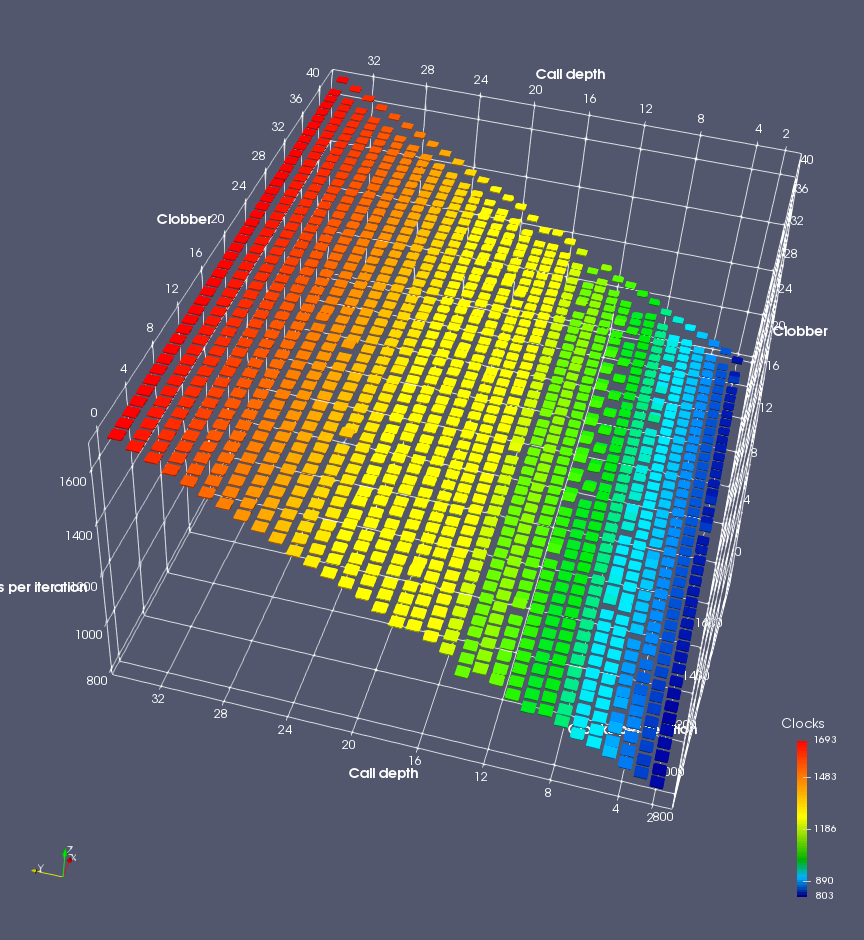
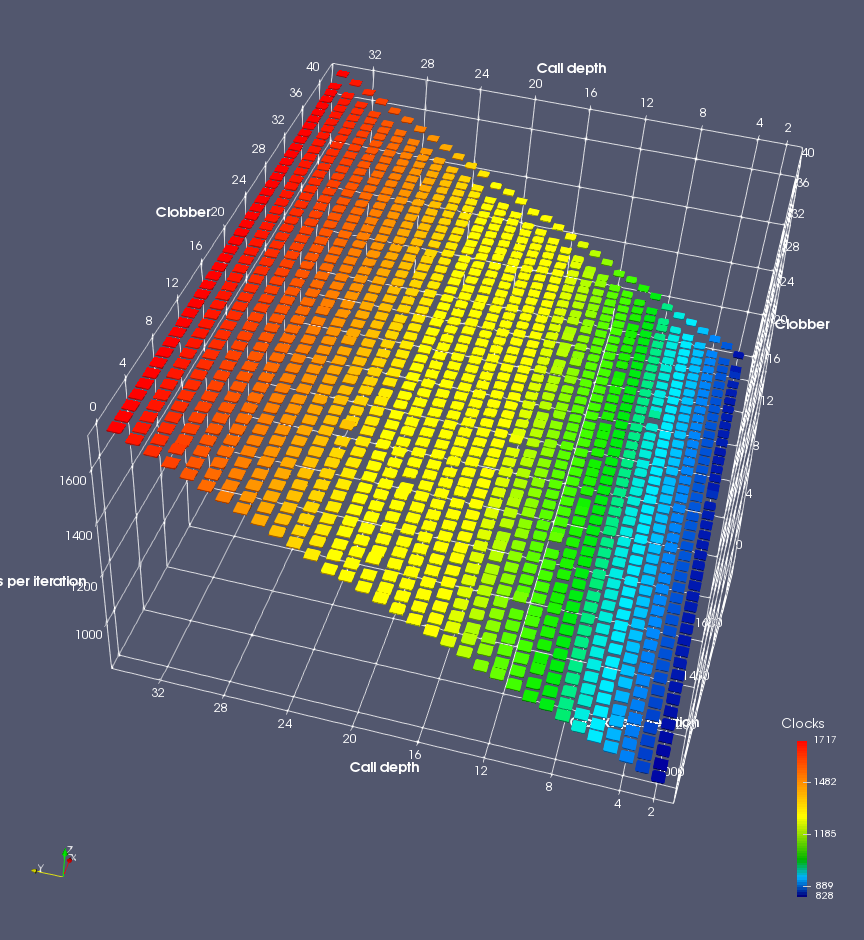
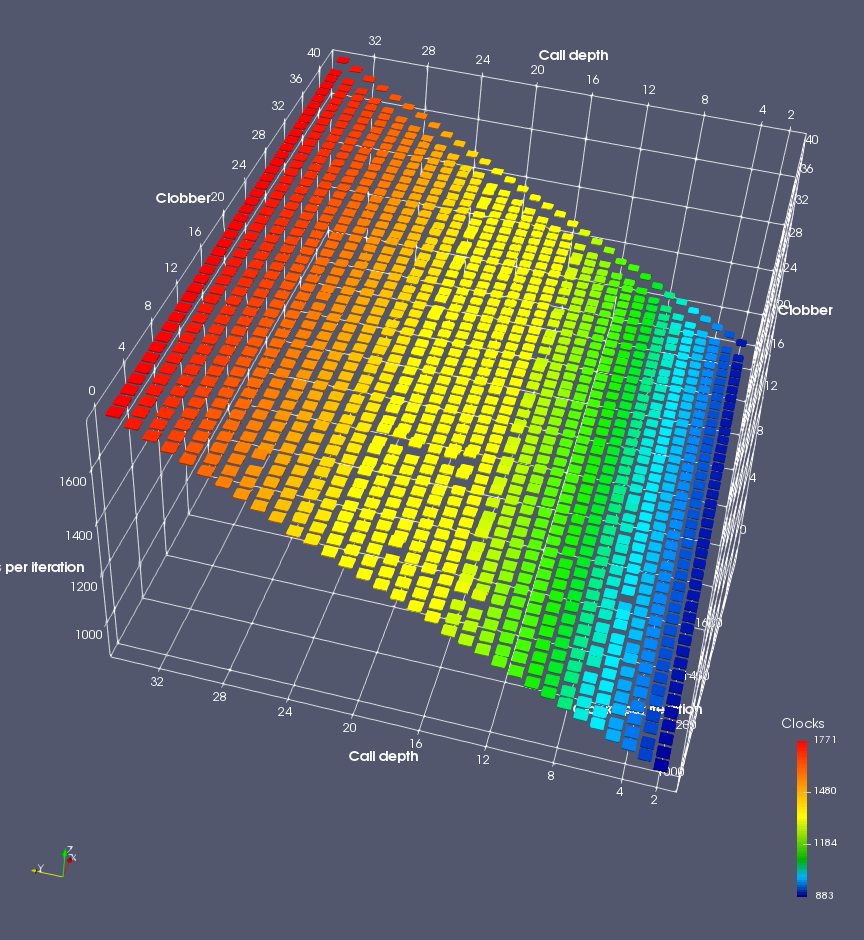
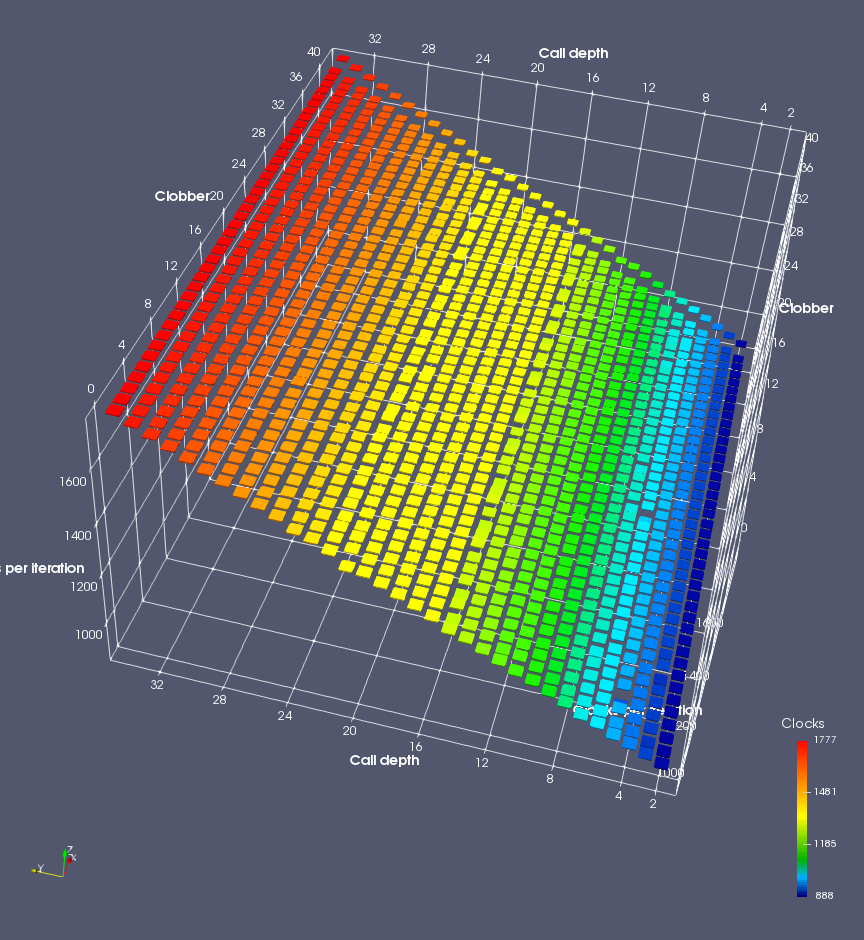
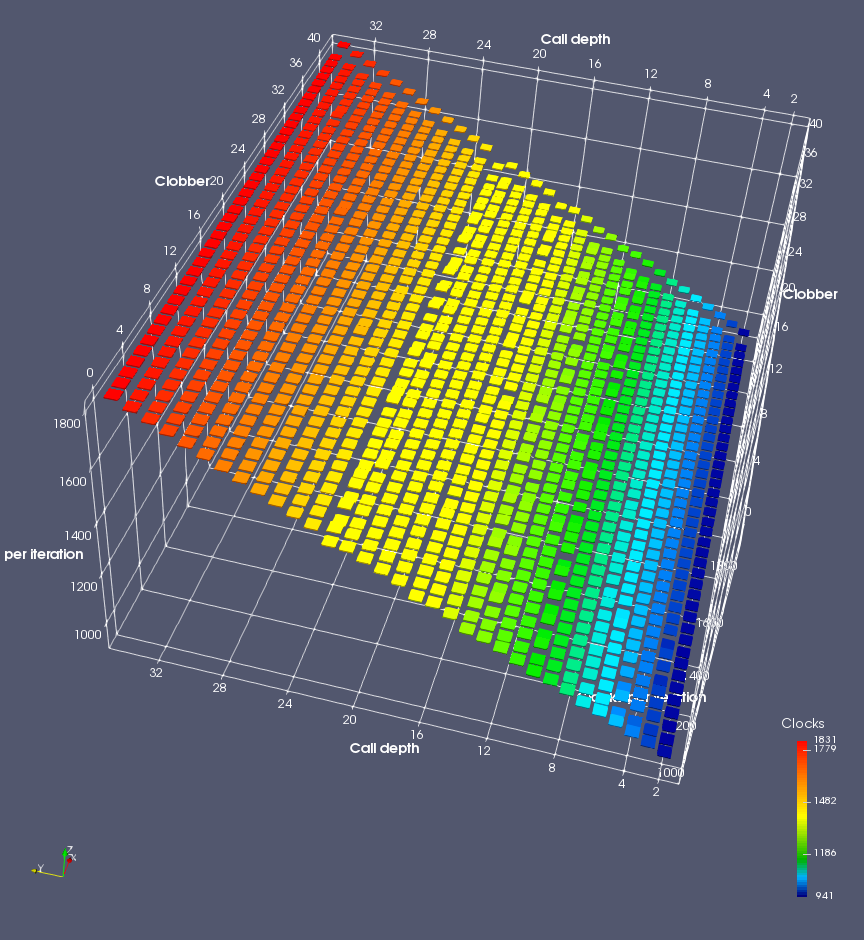
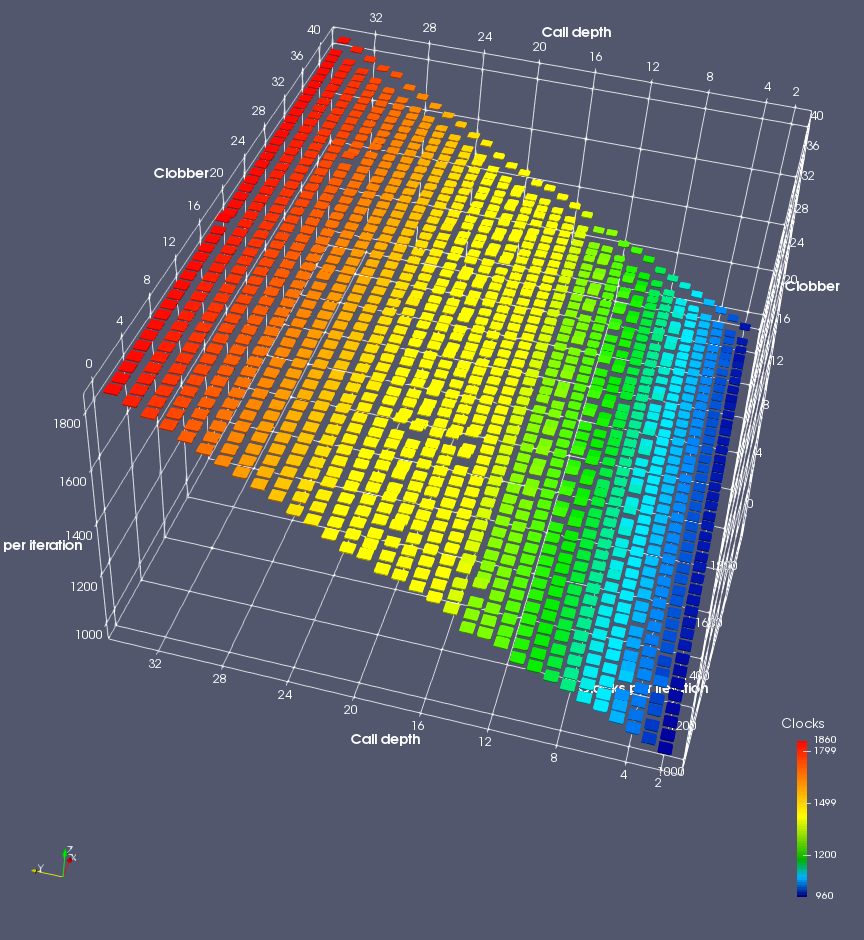
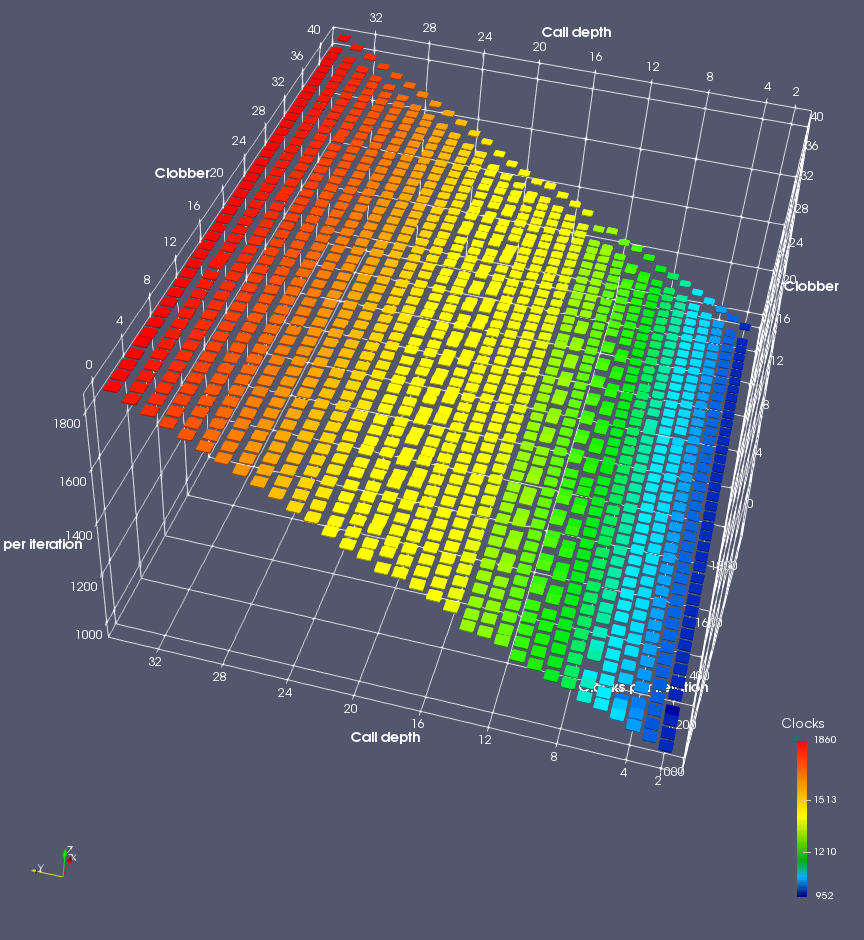
In this experiment, I added two more independent variables. First, to deliberately introduce misalignment, some number of returns are removed or added to detect whether a deliberate misalignment might perfectly match one of the TOS misalignments detected in the earlier microbenchmark. The second new variable is to control how many call instructions are used to attempt to clobber RAS entries, varying from 0 to “as many as possible”. This was done to attempt to see whether the number of speculative calls could affect how many RAS entries were clobbered (revealing information about any limits on speculative RAS entries). This experiment is plotted as a sequence of 3D plots (effectively four dimensions of data) in Figures 6 and 7.
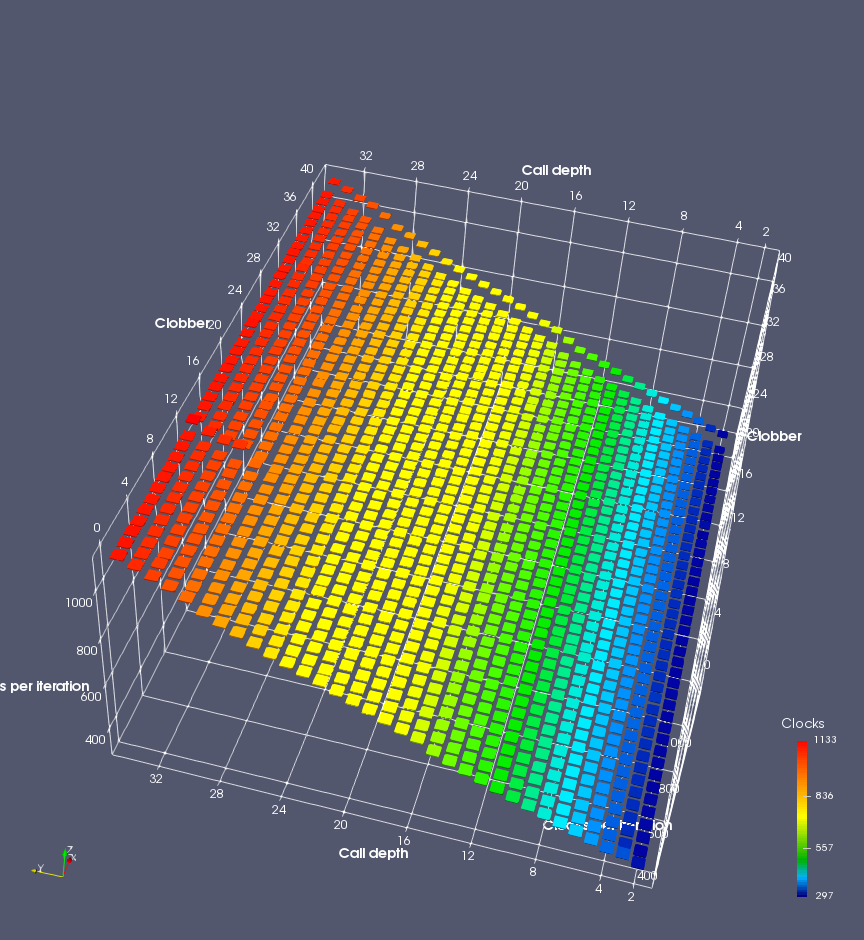
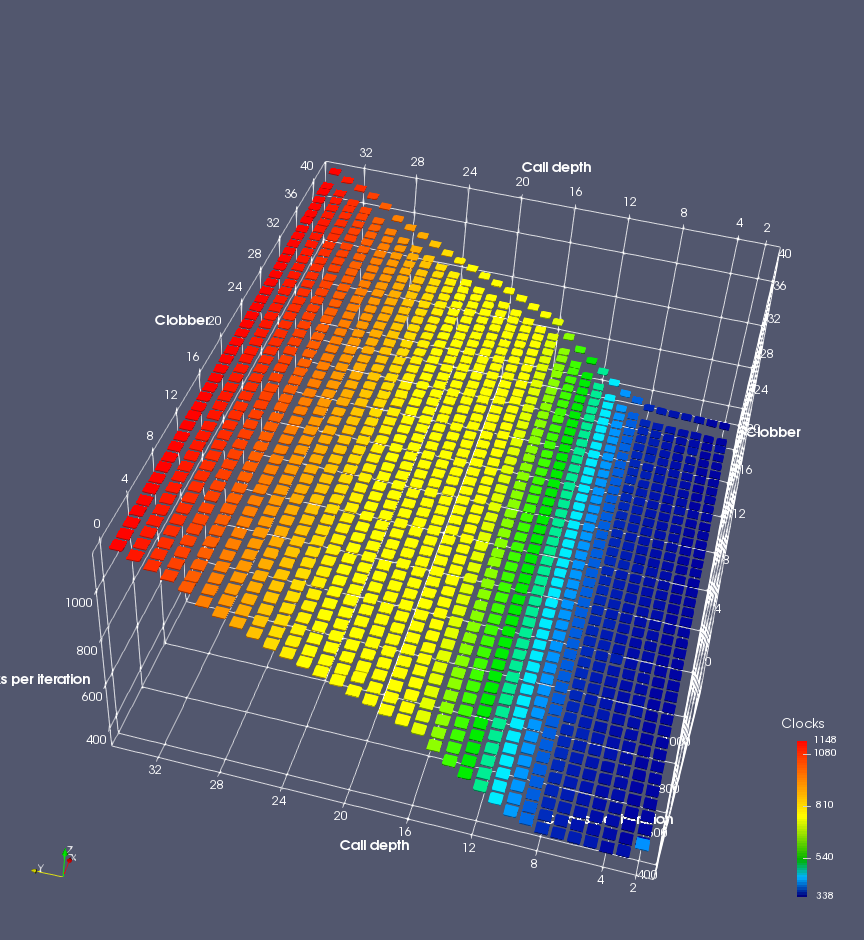
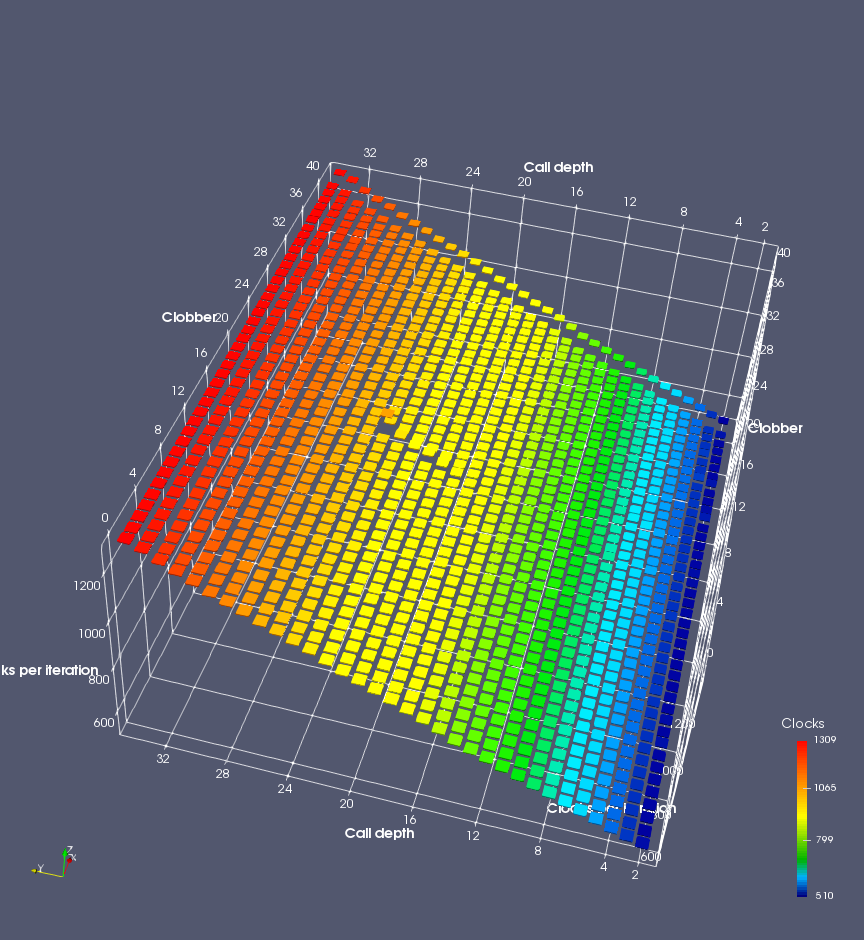
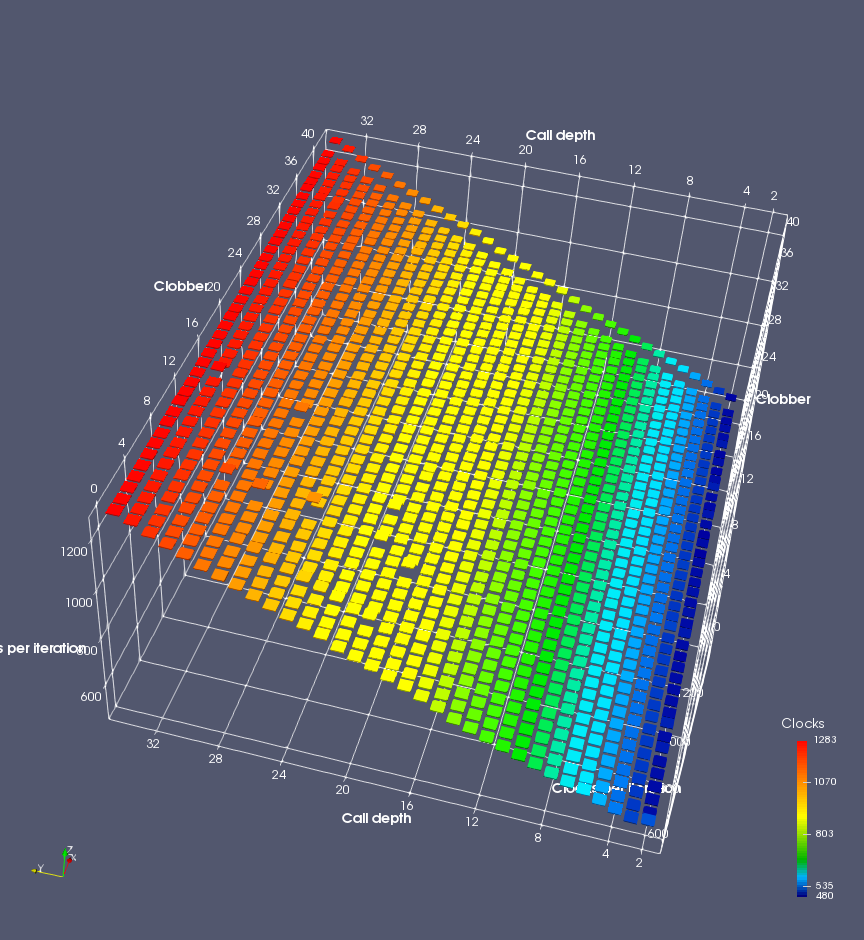
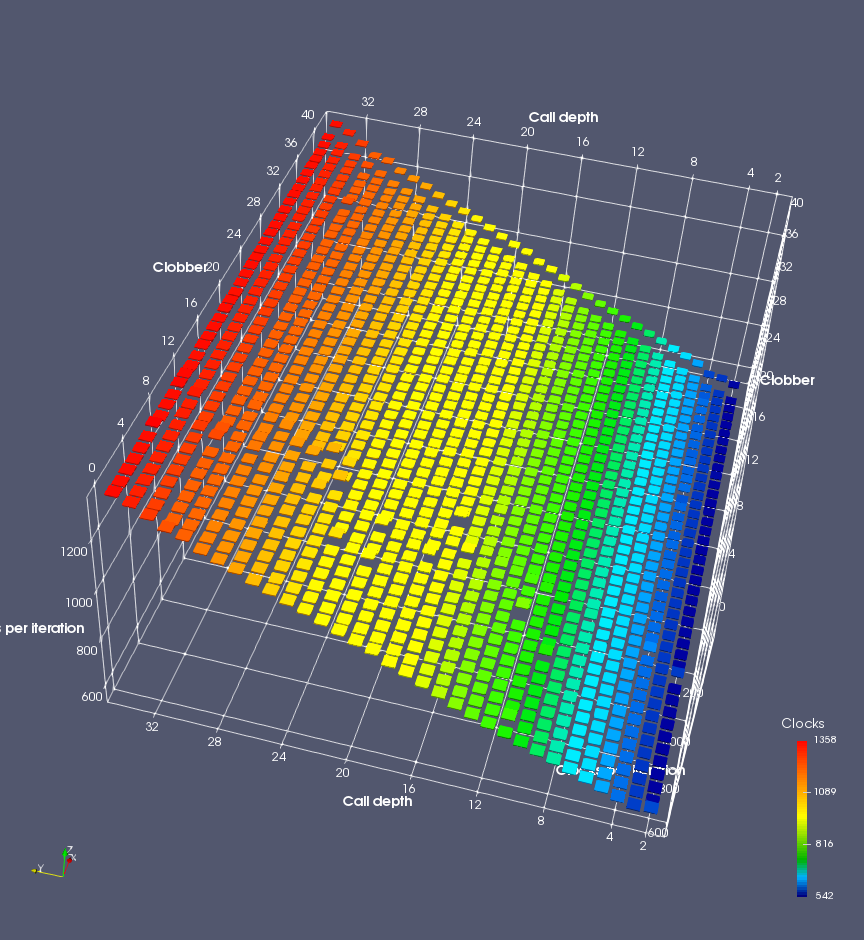
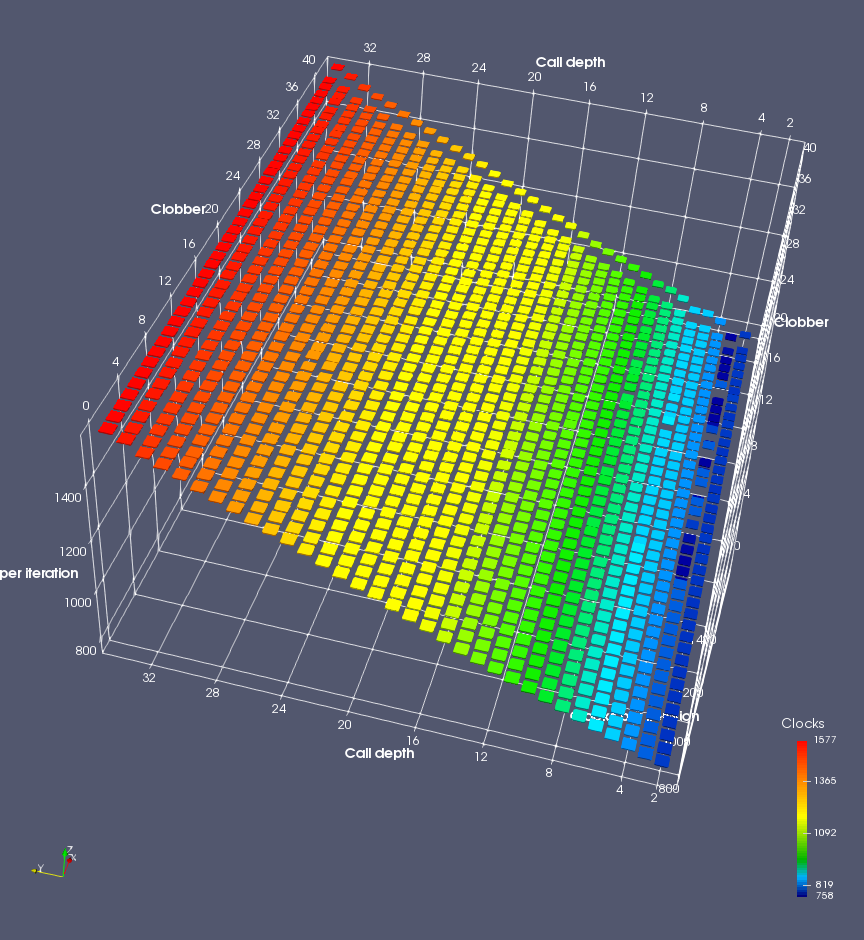
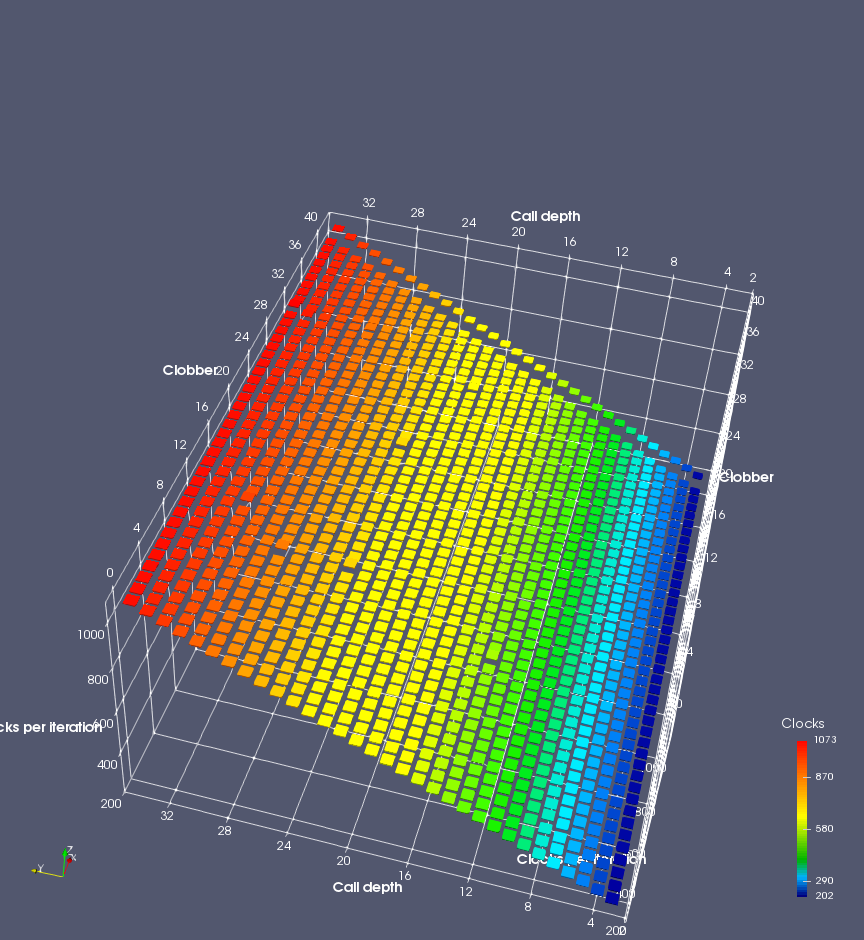
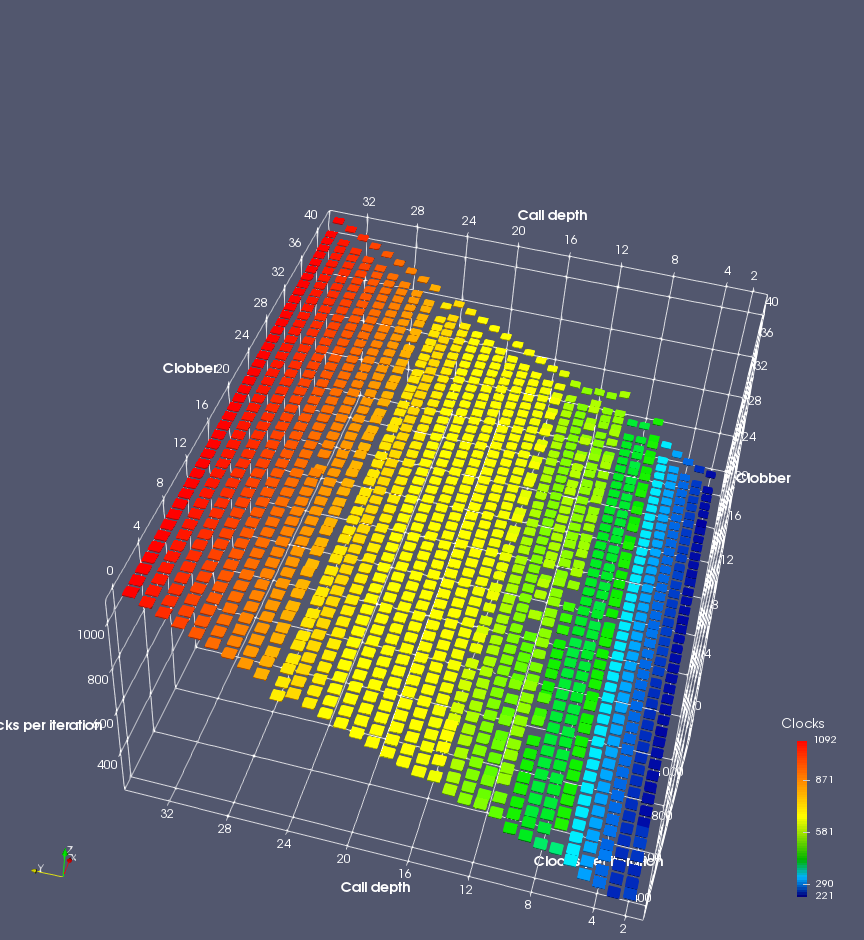
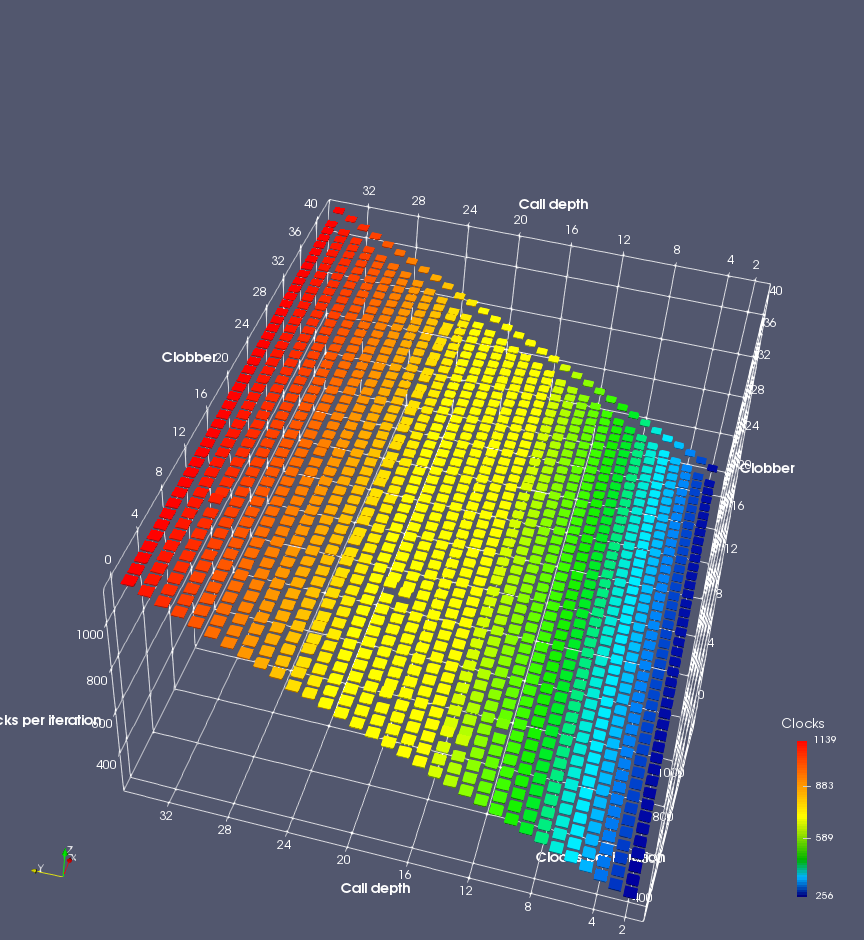
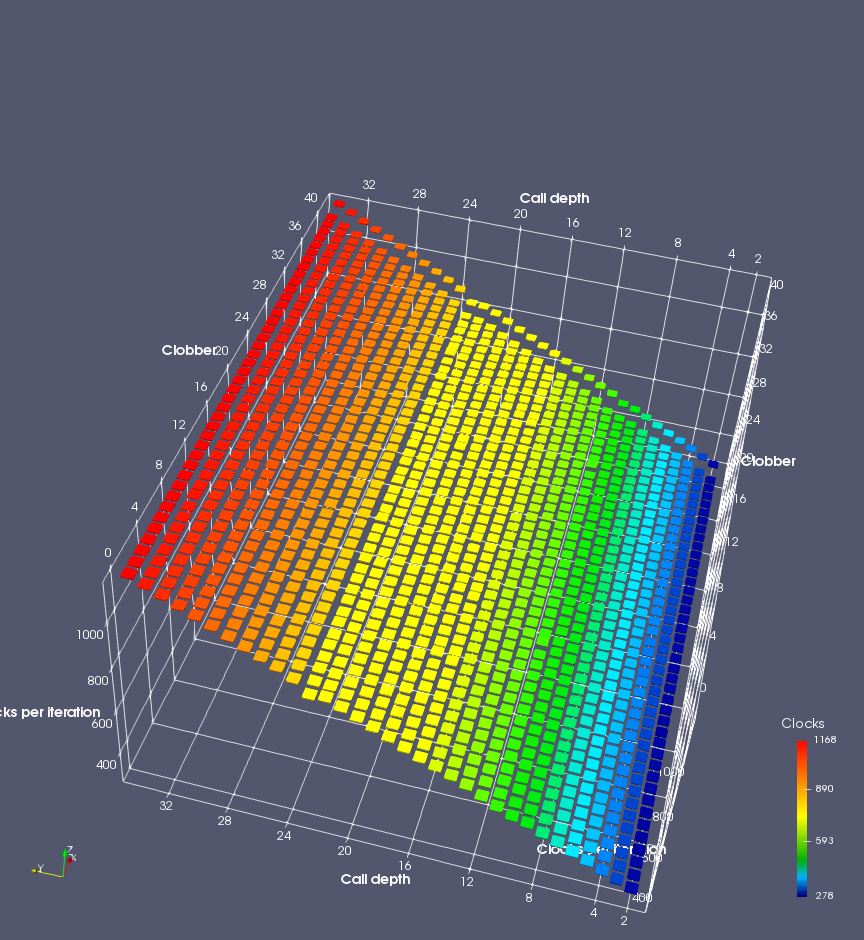
Figure 6 plots data for Intel Ivy Bridge, while Figure 7 is for AMD Bulldozer. In each figure, the results for pipeline flushes caused by both an indirect branch misprediction and return misprediction are plotted side by side for comparison. In each plot, the call depth axis is the nested call depth (as in previous tests), while the clobber axis is how many call instructions are executed speculatively to attempt to clobber RAS entries. The special case of “as many as possible” is plotted as clobber=42, but as we will see later, Intel processors do not speculate past 15 calls anyway (unknown for AMD). The tabs for each figure (ranging from -5 to +34) show the effect of removing (negative) or adding (positive) extra returns, with Normal (or 0) being the usual case used in the previous tests. If a non-zero number of returns added/removed resulted in many RAS correct predictions, then the RAS was misaligned by the processor. The Microbenchmark diagram tab describes the microbenchmark in more detail.
-5
-4
-3
-2
-1
Normal
+1

+2

+3

+4
+5

+6
+7


+8

+9
+15
+16

+17


+18
+29

+30

+31
+32

+33

+34
Microbenchmark diagram
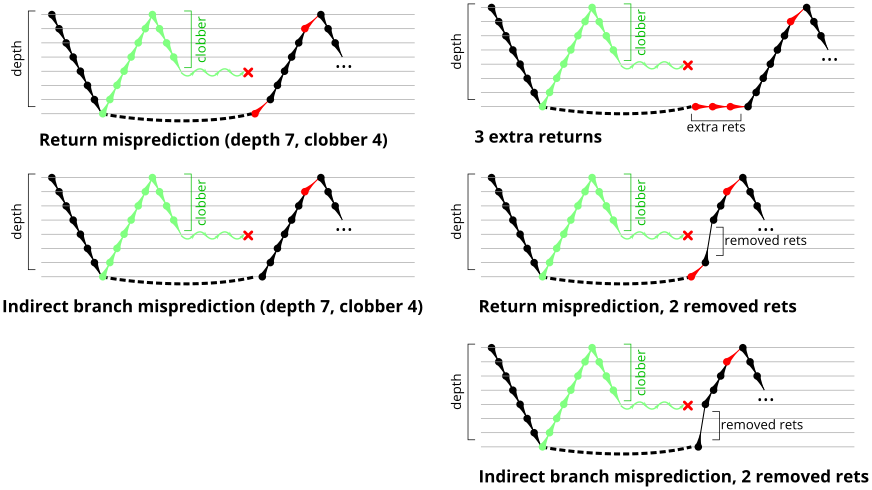
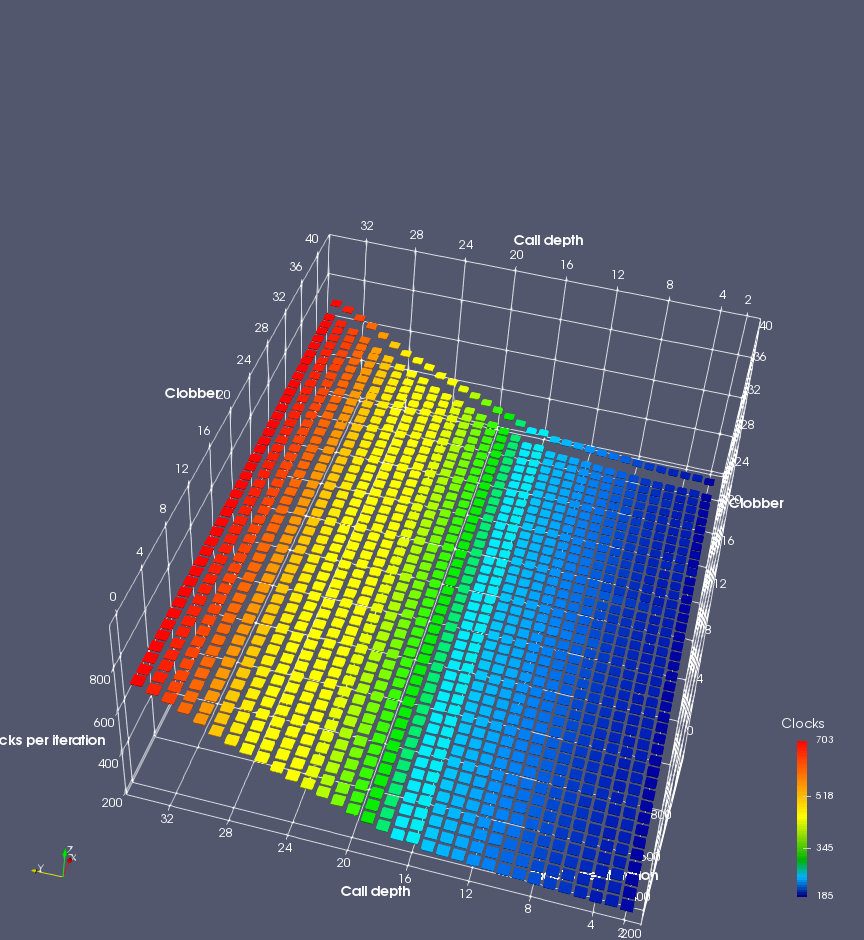
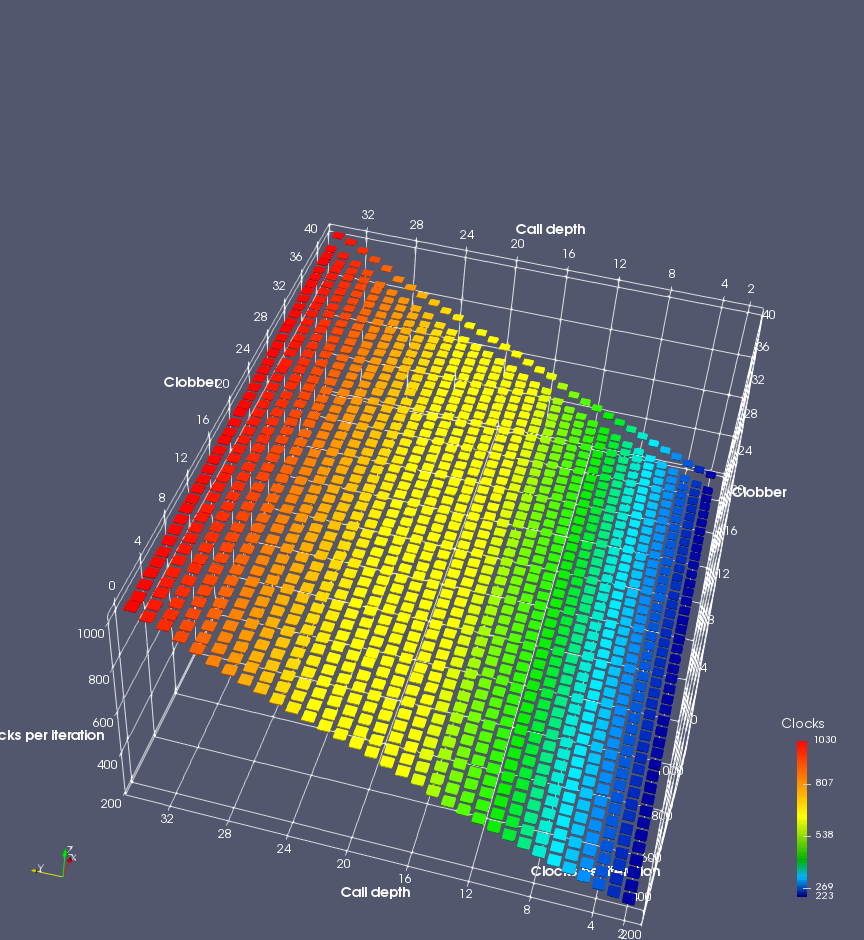
Figure 6 shows the results for Ivy Bridge. On the left (indirect branch mispredict), no sign of any imperfect RAS repair after an indirect branch misprediction is visible. Runtime increases slowly with increasing call depth until depth 16, at which point return mispredictions begin to occur due to RAS overflow, independent of how much clobbering with speculative calls is attempted. Conversely, on the right, some TOS misalignment is obvious (high delay). In particular, the increased delay (return mispredictions) at depths 9, 10, 17, and 18 show up as unusually low delay (unexpectedly correct return predictions) when 2, 4, 2, and 1 returns, respectively, are removed (tabs -2, -4, -2, and -1). This indicates that the reason for these return mispredictions is that the TOS is repaired incorrectly in these cases, with a few entries in the RAS having been unexpectedly popped off. I did not notice any evidence of RAS entries being clobbered.
There is also an interesting pattern where TOS misalignment occurs only if (call depth + clobber >= 15). A similar pattern shows up in Figure 7 (Bulldozer) for (call depth + clobber >= 26). I was not able to come up with any plausible mechanism that would explain this pattern, however.
-3

-2

-1

Normal

+1
+2

+3

+4


+5

+21

+22
+23

+24

+25
+26
+27
+28

+29
Microbenchmark diagram
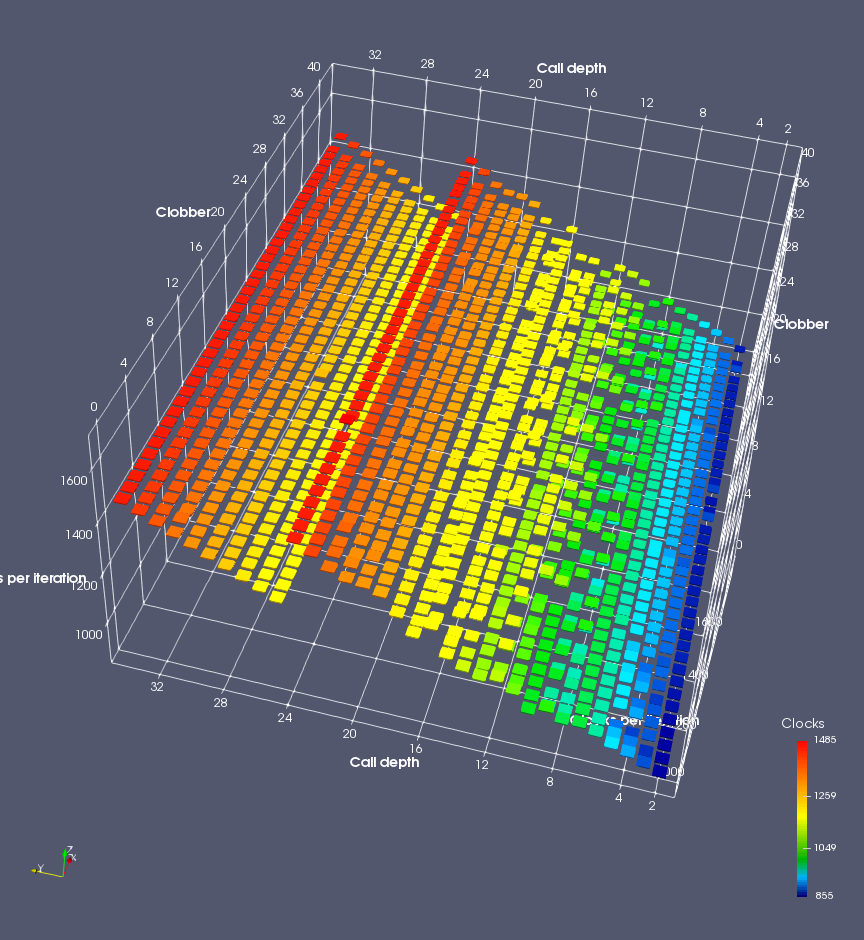
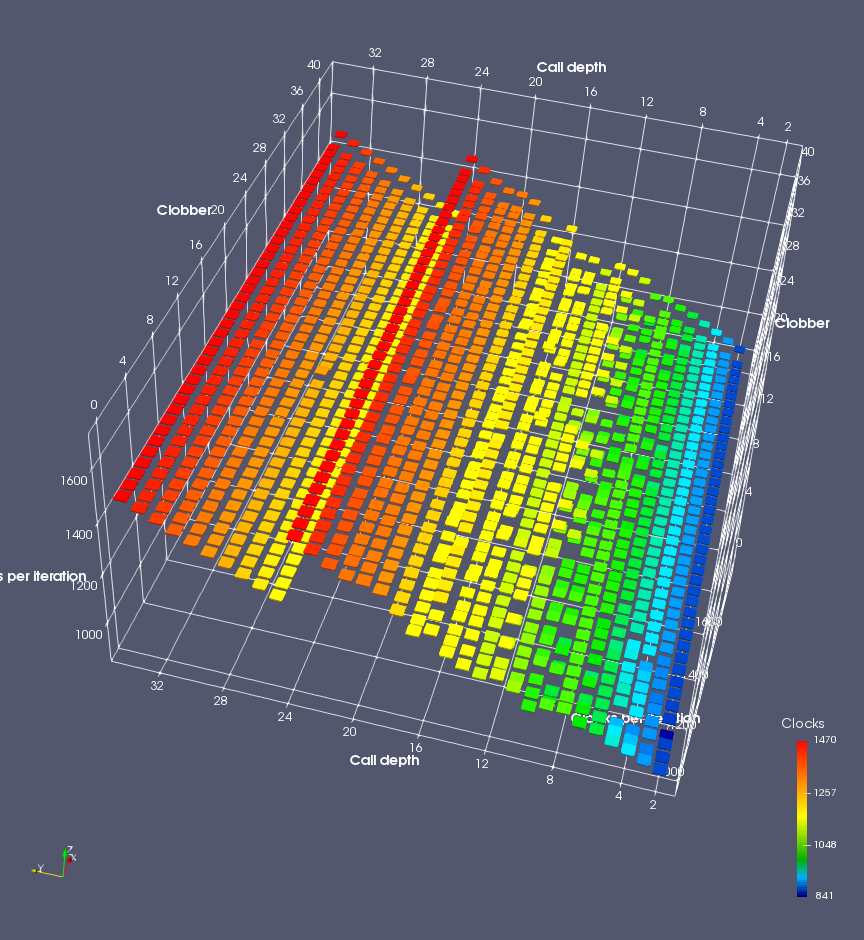
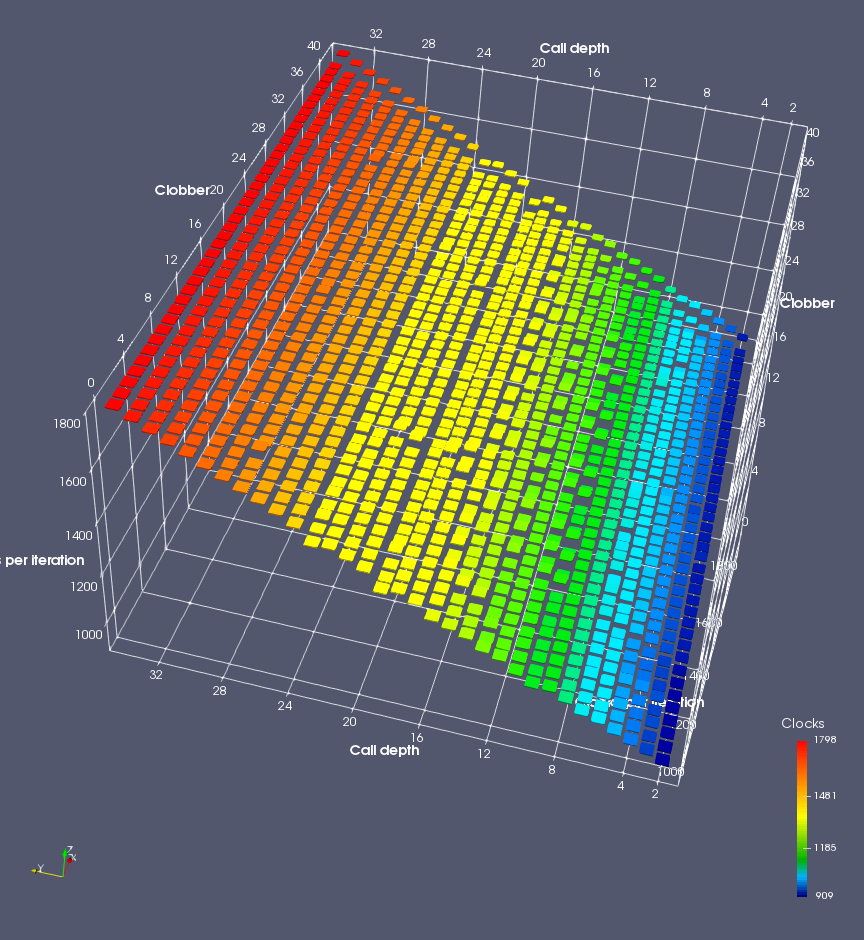
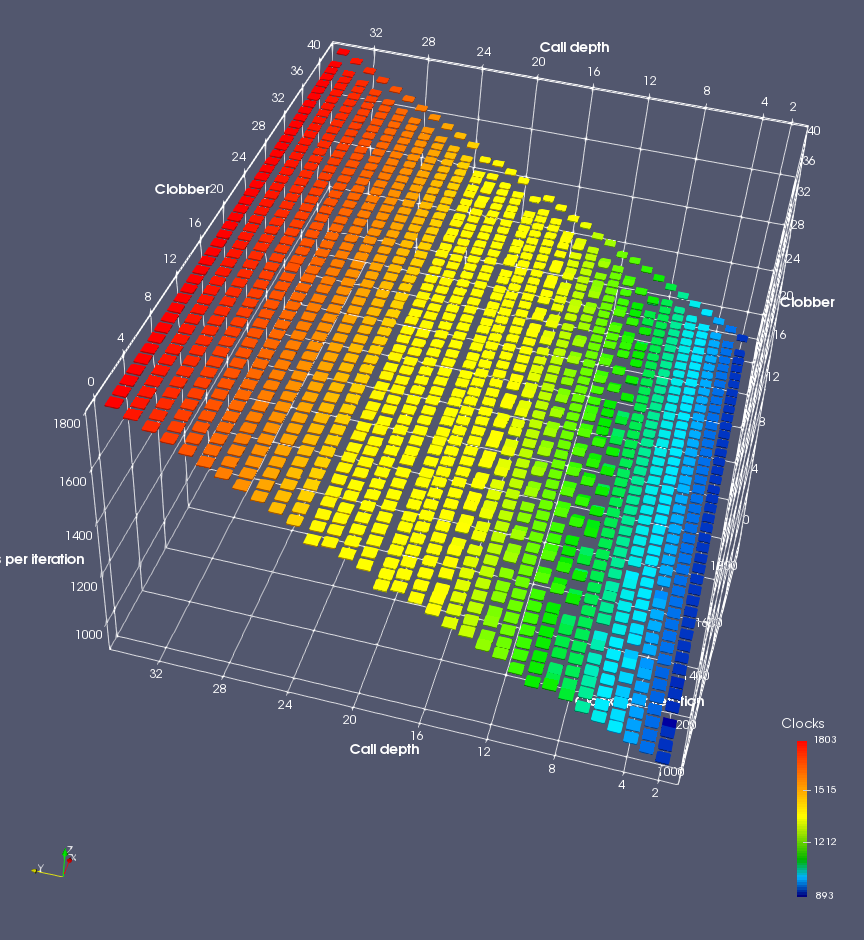
Figure 7 shows the same plot as Figure 6, but for AMD Bulldozer. Most notable in this plot is that Bulldozer appears to misalign the RAS (no correct return predictions) after a return misprediction (right), but not after an indirect branch misprediction (left). What is interesting is that about half of these return mispredictions go away when one extra return is added (Compare the Normal, +1, and +2 tabs), which indicates that the RAS misalignment is off by 1. Bulldozer’s behaviour is surprising, considering that even older AMD processors recover the TOS correctly. A paper (at WDDD 2005) specifically warns about TOS off-by-1 errors [6]. We will further explore Bulldozer’s behaviour in a later section.
Also interesting is that Bulldozer (and Piledriver, not shown) does not have ideal behaviour even when the pipeline flush is caused by an indirect branch misprediction. It is interesting to compare a slice of this plot (Figure 7 left) at clobber=0 with the very similar RAS mispredict + delay, less speculation plot in Figure 5. Figure 7 shows non-ideal delays even with clobber=0, while Figure 5 does not. The difference is that one return is executed speculatively for Figure 5, while call depth returns (but no calls due to clobber=0) are executed speculatively for Figure 7. This suggests that even speculative returns without calls are sufficient to disrupt the RAS repair.
Does the RAS behave like a circular buffer?
On Intel processors, the RAS appears to behave as a 16-entry circular buffer without overflow or underflow checking. Doing a sequence of a multiple of 16 extra returns results in the RAS being aligned. In Figure 6 (Ivy Bridge), adding 16 or 32 extra returns (tabs +16 and +32) to the sequence of returns appears to result in very similar behaviour (correctly-predicted returns) to the Normal case. It appears as though doing a multiple of 16 returns (which should completely empty the RAS) actually preserves the RAS contents, and leaves the RAS TOS pointer unchanged.
AMD processors do not appear to behave the same way. Phenom and Phenom II processors don’t seem to show special behaviour if 24 extra returns are done (it gives no correct predictions as if misaligned). Bulldozer and Piledriver microarchitectures show unusual behaviour when there are 24 (RAS size) extra returns, but it seems to get correct return predictions only when the call depth exceeds 24. It feels as though there is some kind of RAS underflow checking done imperfectly. I have not investigated this further, but RAS bounds checking seems plausible because AMD processors have a performance counter that counts RAS overflow events (“RETURN_STACK_OVERFLOWS”, code 0x89). On Bulldozer, the broken return misprediction behaviour makes this harder to see compared to Piledriver, but it is still visible in tab +25 (25 extra returns) of Figure 7 (This pattern shows up in tab +24 for Piledriver, which does not have Bulldozer’s TOS misalignment problem).
Further experiments on Bulldozer
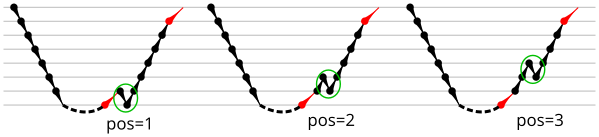
Earlier, we saw that on Bulldozer, a single mispredicted return can cause the return address stack to be misaligned, causing every subsequent function return to be incorrectly predicted. I showed that deliberately mismatching calls and returns by adding one extra return partially reverses the misalignment. However, it does not completely reverse the misalignment, so in this section I try to look more closely at how Bulldozer’s RAS behaves after a return misprediction.
The first observation is that adding delays (IMUL instructions) to various places did not affect the RAS behaviour after one return misprediction. This suggests that the cause is not related to timing or some race condition inside the processor.
The next observation is that inserting a single matched Call-Ret pair somewhere in the middle of the chain of (mispredicted) returns seems to cause the remaining returns to be correctly predicted again. This suggests that the RAS top-of-stack pointer misalignment is not permanent, but only lasts until the next matched Call-Ret instruction pair (It is shown later in this section that the RAS TOS pointer is realigned after the next correctly-predicted RET instruction, and a call is not required.)
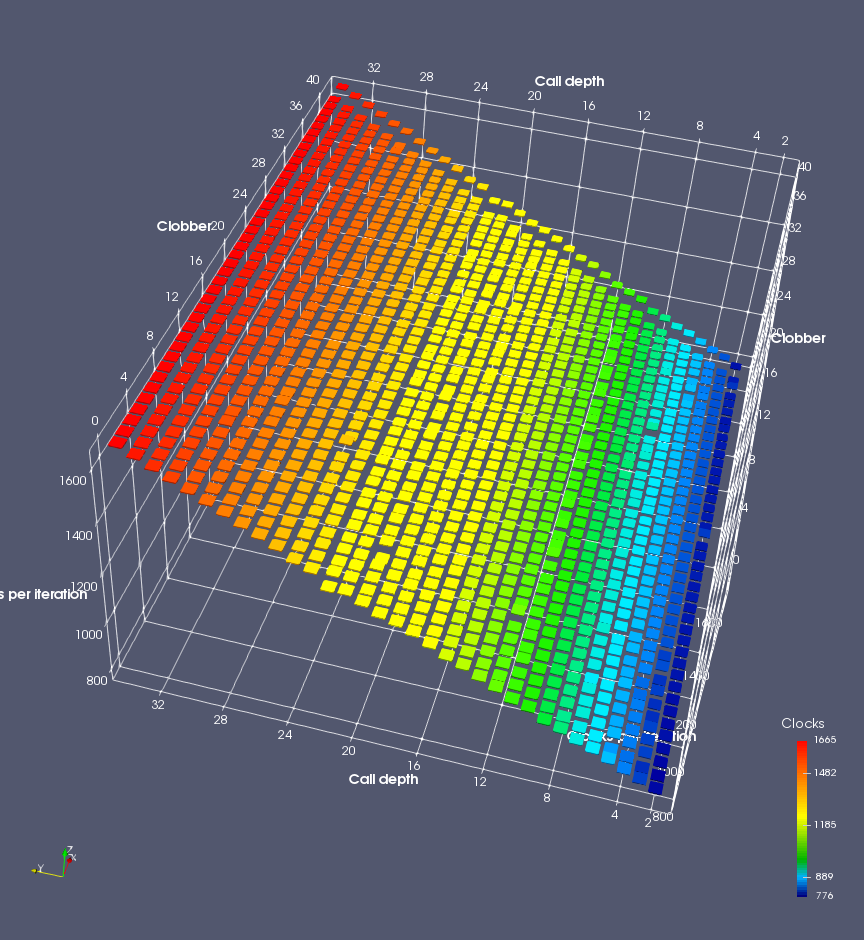
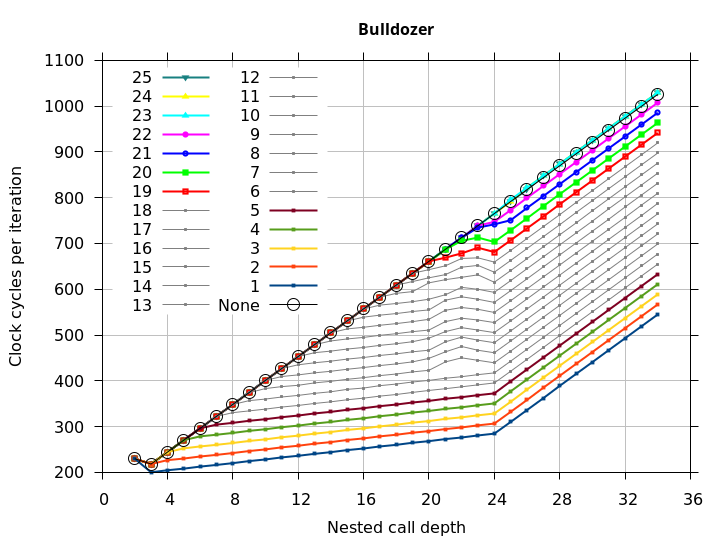
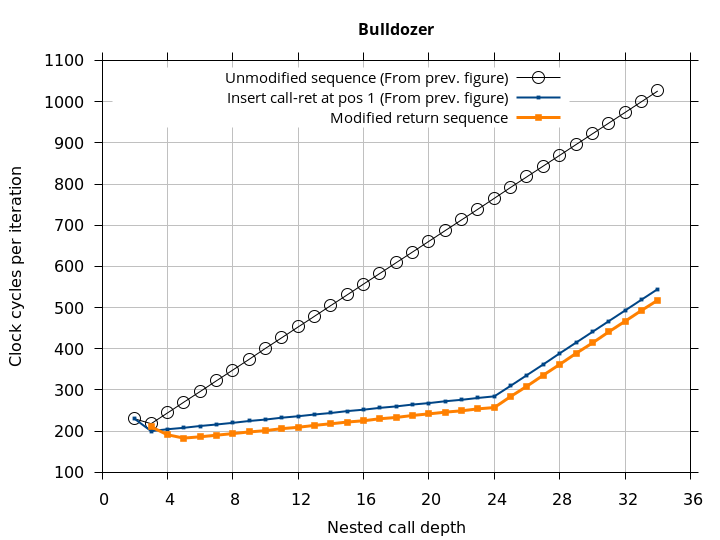
Figure 8 shows the runtime of correctly-matched nested function calls (including the 32-IMUL delay at the deepest function call), except that the deepest return returns to a different address than its corresponding call (to create the first return misprediction). The x axis is the depth of the nested function calls (so greater depth usually means longer runtime). With no call-ret pair inserted (labelled None), this microbenchmark is equivalent to RAS mispredict + delay in Figure 5. The rest of the plotted lines (labelled 1 through 25) show the effect of inserting a Call-Ret pair of instructions after the nth return. See the Microbenchmark diagram tab for more details on the microbenchmark.
The plots show that after the first return misprediction, an incorrect RAS top-of-stack pointer causes every subsequent return to be mispredicted, but that as soon as a Call-Ret instruction pair is executed, the remaining returns (up to 24, the RAS capacity) are all correctly predicted. This means that even though a return misprediction causes the TOS to be misaligned by 1, the TOS misalignment does not get worse with each subsequent mispredicted return, and a matched Call-Ret will undo the misalignment regardless of how many returns preceded it. It appears as though Bulldozer’s error is not that the TOS is tracked incorrectly, but that the processor enters a “state” where the TOS is off-by-1, and the processor can exit this state (and restore the correct alignment) by executing a matched Call-Ret instruction pair.
Bulldozer
Microbenchmark diagram
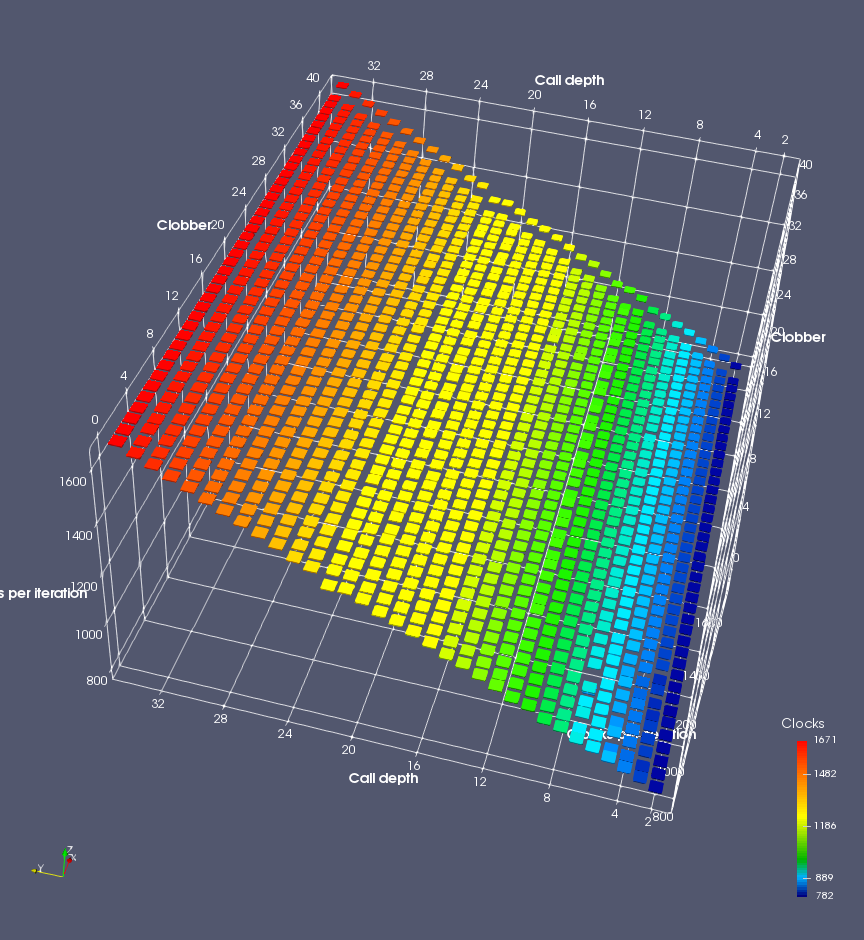
By this point, we have a fairly good idea of how to trigger and recover from the RAS misalignment. We will take this one step further and find the sequence of returns that will match the RAS behaviour and result in no return mispredictions. This microbenchmark performs call depth calls, then modifies the return addresses on the stack (in memory) with the first return being deliberately incorrect, then performs call depth returns. If the modified return sequence matches what the RAS “expects”, we will see exactly one mispredicted return (until call depth overflows the RAS). This simplifies the microbenchmark even further than Figure 8 by not requiring an extra call and return to be added.
The sequence of returns that results in correct predictions is shown in the Microbenchmark diagram tab of Figure 9. It appears that after a return misprediction, the processor misaligns the RAS by 1 position until the next correct return prediction occurs (a call instruction is not required). In the Plot tab, we see that this sequence indeed appears to get no return mispredictions (beyond the first, deliberate, misprediction).
Plot
Microbenchmark diagram
Maximum in-flight branches and calls
Out-of-order processors speculatively execute instructions, using branch prediction to guess the correct path. As we saw above, speculatively executing calls and returns makes RAS predictor design more complex due to the need to recover from incorrect speculations. Thus, it is plausible that the RAS design may limit the amount of speculation in some cases, perhaps in exchange for reduced RAS complexity. This section attempts to measure the maximum number of in-flight branch and call instructions that a processor will support.
The method used in this section relies on CPU performance counters to count the number of (speculative and non-speculative) executed branches. The microbenchmark executes carefully-crafted instruction sequences, while performance counters are used to observe how many speculative branches were executed. The performance counters were observed to not be entirely accurate, so the results observed here may be slightly different than reality. Also, AMD processors (at least up to Piledriver) do not have performance counters that count the number of (speculatively) executed branches, so I tested only Intel processors. It is possible for a microbenchmark to make this measurement without needing to use performance counters, but it is somewhat more complex, so I have not attempted it. Figure 10 shows the results.
Results
| Processor | Max. branches | Max. calls | Max. calls (after 2 rets) | Max. calls (after 3 rets) |
|---|---|---|---|---|
| Pentium Pro | 40 | 13 | 1 | 1 |
| Core 2 45nm | 91 | 19 | ? | ? |
| Nehalem | 123 | 15 | 1 | 1 |
| Sandy Bridge | 48 | 15 | 15 | 15 |
| Ivy Bridge | 48 | 15 | 15 | 15 |
| Haswell | 48 | 14 | 14 | 14 |
Microbenchmark diagram
The instruction sequence used in this microbenchmark is shown in the Microbenchmark diagram tab. It uses a single call and mispredicted return pair (that I’m sure you’re familiar with by now) to cause speculative execution of an infinite loop of JMP or CALL instructions. It is very similar to the microbenchmark from Figures 6 and 7, with call depth=1 and clobber=infinite. Performance counters measured the total number of branches or calls executed. I then subtract out the one call and one (mispredicted) return that executes in each loop iteration. The remaining calls (or branches) are those that were speculatively executed beyond the return misprediction. A variation on this microbenchmark performs two (or more) returns immediately before the sequence of calls, to detect whether a limit on the number of in-flight calls is independent of in-flight returns. The Results tab in Figure 10 summarizes the results.
Pentium Pro and Lynnfield (Nehalem microarchitecture) (and presumably other P6-derived microarchitectures) seem to limit the number of in-flight branches to the reorder buffer size (40 and 128, respectively), while Sandy Bridge and newer have a lower limit of 48 branches. This may indicate that Sandy Bridge and newer uses a separate structure to handle branches (a branch ordering buffer?) that has a lower capacity than the ROB (168 entries on Sandy Bridge and Ivy Bridge, 192 entries on Haswell).
On Intel Sandy Bridge to Haswell, the limit on the number of in-flight calls does not depend on the number of in-flight returns. Thus, the limit of 14 or 15 applies to calls only.
The Pentium Pro and Lynnfield (and other P6-derived microarchitectures?) appear to not execute past the first call instruction when there are two or more returns in flight. I have no data to suggest why this behaviour would be desirable. If I had to guess, it might be due to avoiding RAS clobbering: Executing calls after more than one return might cause more RAS damage than the repair mechanism could repair, and stopping speculation when this occurs might have been a better trade-off than allowing some RAS entries to be corrupted. However, this explanation doesn’t make all that much sense for Lynnfield, as the Nehalem microarchitecture was advertised with a “renamed return stack buffer”, which I imagine would have allowed this kind of restriction to be removed…
Conclusions
This article presented a set of microbenchmarks for measuring a processor’s return address stack branch predictor and other related behaviours. It started with fairly simple microbenchmarks that confirmed that the RAS works, and measured its capacity. Then the microbenchmarks progressively got more complex as I probed imperfections in RAS repair after pipeline flushes. Unfortunately, the microbenchmarks were not able to figure out the internal operation of the RAS, such as the mechanism used to repair the RAS after a pipeline flush (whether it related to the mechanism proposed in Skadron et al. [5], “renamed”, or something else).
This is a summary of the interesting results:
- The return address stack is more effective for predicting function returns than the indirect branch predictor
- Call-next-instruction (call +0) is used to retrieve the current instruction pointer, and isn’t treated as a function call by the RAS, except on the Nano U3500
- RAS capacity was measured
- Several imperfections in repairing the RAS after a return misprediction in the presence of speculative calls and returns were detected. Bulldozer’s behaviour seems like a performance bug that was fixed in Piledriver.
- Intel’s RSBs behave like a circular buffer without bounds checking, while AMD’s seem to do bounds checking, though not always correctly.
- On Intel’s CPUs, there is a limit to the number of in-flight calls (13-15) that seems related to the RAS. P6-derived CPUs can speculate roughly as many branches as the reorder buffer capacity, but newer Sandy Bridge through Haswell processors are limited to only 48 in-flight branches, perhaps by a new hardware structure.
Future work
I might add measurements for some other microarchitectures soon. Or I might not.
Appendix 1: Microbenchmarking is hard
As usual, creating usable microbenchmarks to measure detailed behaviour of a processor is difficult because of the many things the microbenchmark may be accidentally measuring instead. Here is a summary of some of the bigger problems I encountered when creating this set of microbenchmarks
- On the AMD K8 and K10, taken branches will only be predicted if (approximately) the branch instruction occupies one of the instruction fetch bytes that contain branch indicator bits. In each 16-byte fetch block, these exist at 0 and odd-numbered offsets. This causes problems with return instructions that are only one byte long, which could be easily be placed in a location with no branch indicator bits. Thus, every relevant return instruction in the microbenchmark is hand-verified to be located at either a 16-byte aligned or odd-numbered location. Branch density is a concern as well, as only three branches per 16 byte block can be predicted. Thus, the microbenchmark ended up adding some padding to reduce the branch density enough. More details on this behaviour can be found in Agner Fog’s microarchitecture guide [1].
- One unusual characteristic of this microbenchmark is that part of the code was designed to only be executed speculatively, never non-speculatively. This exposes many paging-related issues. First, the OS demand-faults executable code from disk into memory. The first time code is executed, it generates a page fault that then causes the OS to load the code page into memory. This is normally not a problem, as it only causes an initial delay in the first iteration, and can be easily avoided. However, if the speculatively-executed code is located in its own page, it never (non-speculatively) causes a page fault, and is never faulted into memory, and the code never executes. Thus, we need to non-speculatively fault-in the code page before using it.
- It was also discovered that some processors (at least Ivy Bridge) will not speculatively execute code located in a page that is not in the instruction TLB (it will also not speculatively fill the ITLB entry). The resulting symptom is that the speculative-only code will work for a while, and then cease to execute some random amount of time later (typically millions of cycles) when its ITLB entry gets evicted. The solution is to periodically non-speculatively execute code near the speculative code to keep the code page in the ITLB.
- Choosing a method to use as a delay is not easy. Some methods work better than others, and it is not always clear to me why. A sequence of IMUL instructions usually worked well, but did not work well when measuring the maximum number of in-flight branches on Lynnfield. I suspect IMULs did not work well in this case because a long chain of IMULs occupies instruction scheduler space that crowds out speculative branches, so the amount of speculation was initially limited by scheduler space, but then as the scheduler drained of IMULs, the amount of speculation became limited by execution bandwidth of branches (competing with IMUL) rather than the (quite large) ROB capacity.
Appendix 2: List of processors tested
| Short name | Description | CPUID family-model-stepping |
|---|---|---|
| Pentium Pro | 233 MHz, 256 KB L2 cache | 6-1-9 |
| Core 2 45nm | Core 2 Quad Q9550 | 6-23-10 |
| Lynnfield | Core i7-860 | 6-30-5 |
| Sandy Bridge | Core i5-2500K | 6-42-7 |
| Ivy Bridge | Core i5-3570K | 6-58-9 |
| Haswell | Pentium G3420 | 6-60-3 |
| Phenom | Phenom 9550 | 16-2-3 |
| Phenom II | Phenom II X6 1090T | 16-10-0 |
| Bulldozer | FX-8120 | 21-1-2 |
| Piledriver | FX-8320 | 21-2-0 |
| Nano U3500 | VIA (Centaur) Nano U3500 | 6-15-8 |
Misc.
Source Code
References
![[pdf]](https://blog.stuffedcow.net/wp-content/plugins/papercite/img/pdf.png)
Cite
- H. Wong, Microbenchmarking Return Address Branch Prediction, Apr., 2018. [Online]. Available: http://blog.stuffedcow.net/2018/04/ras-microbenchmarks
[Bibtex]@misc{ras, author={Henry Wong}, title={Microbenchmarking Return Address Branch Prediction}, month={apr}, year=2018, url={http://blog.stuffedcow.net/2018/04/ras-microbenchmarks} }
Great post.
The in-flight limits of 48 branches and 14 or 15 calls are new to me. Especially the call limit seems like it could be hit pretty easily in certainly types of code.
Do you know the nature of the stall that occurs when you hit the limit in these cases? For example, does it stall the dispatch/execution of all newer instructions, or only of newer branch/call instructions? If the latter, it doesn’t seem like much of a problem in practice, since the rest of the instruction flow can keep executing (and branches/calls by definition don’t participate in data-dependency chains except as leaves), but if it’s the former it seems like you could notice it for sure in some real-world code.
Even if it’s the better case of stalled calls/branches instructions only, I guess it could hurt you if the paused branch/call resolution resulted in later resolution of a branch misprediction.
I suppose it would be possible to measure, but I haven’t done so. My expectation is that the stall occurs at or before the rename/allocate stage, blocking all later instructions when the 15th/16th call (or 49th branch) needs some resource and can’t get it.
I think it’s less likely that the extra calls/branches can pass the rename stage and be placed into the instruction schedulers (which allows later instructions to be renamed/scheduled/executed), yet be forbidden to execute while sitting in the scheduler. (What mechanism would allow a call sitting in an out-of-order scheduler to know whether it is within the first 15 calls according to program order?)
My guess would be that this limit wouldn’t really hurt IPC by much. I imagine it’s quite rare to have code that contains 15+ calls closely spaced. The ROB is on the other of 100 uops, so you wouldn’t even hit this limit unless the code averages less than ~6 other instructions per call, for 15 calls in a row (or about one non-branch instruction per branch, for 48+ branches in a row. Even tight loops usually have more than 1 instruction in the loop body…). Even if this case does occur, the net effect would look like a temporary reduction of the ROB size, which I suspect isn’t that costly. This is also assuming that you don’t hit any branch mispredictions anywhere.
Good point that this is most likely resolved in the in-order part of the pipeline since it fundamentally an in-order concept.
I agree that it is rare to have so many calls that this would hurt IPC but might disagree about “quite” rare depending on the definition. The ROB may be “on the order” of 100 uops, but on modern Intel CPUs the exact number is > 200 (published, and you’ve also shown this in other posts), so number of instructions per calls needed is something like 12. If a compiler can inline a call it should in this case, but in many case it won’t, so I think it’s entirely possible that it doesn’t.
You are right about the effect being just an apparent reduction of ROB size, so in many cases the effect might be small-to-none. I guess the worst case is code that is very sensitive to ROB size, such as code that has a number of spaced-out memory misses such that the available ROB size directly corresponds to available MLP.
Do in-flight ret instructions count against the 48 entry in-flight branches limit?
I don’t remember. Based on my description of the tests, I don’t think the tests I did would have answered your question (I only tested with repeated JMPs and CALLs, not RETs.) My guess (based on no data) is: RET and CALL are also unconditional branches, so why would it not be subject to the 48 in-flight branch limit?
Intel’s renamed RSB implementation is described in the Intel Technology Journal, Volume 12, Issue 3 (2008) – basically they keep two pointers, one at which new RSB entries are allocated, another at the true TOS; a list of past TOSes is maintained as well. The separation of call/alloc and ret chains is sufficient to restore the RSB contents after speculating down a path with CALL/RETs.