On conventional out of order processors, instructions are not necessarily executed in “program order”, although the processor must give the same results as though execution occurred in program order. This is achieved by preserving an in-order front-end (fetch, decode, rename) and in-order instruction commit, but allowing the processor to search a limited region of the instruction stream to find independent instructions to work on, before rearranging the instruction results back in their original order and committing them.
The reorder buffer (ROB) is a queue of instructions in program order that tracks the status of the instructions currently in the instruction window. Instructions are enqueued in program order after register renaming. These instructions can be in various states of execution as the instructions in the window are selected for execution. Completed instructions leave the reorder buffer in program order when committed. The capacity of the reorder buffer limits how far ahead in the instruction stream the processor can search for independent instructions. This has been steadily increasing over many processor generations.
The instruction window can also be limited by exhausting resources on the processor other than reorder buffer entries. In physical register file microarchitectures (Pentium 4, Intel Sandy Bridge and newer), the effective instruction window can also be limited by running out of physical registers for renaming.
In this article, I describe a microbenchmark to measure the size of the instruction window and present results for several processor microarchitectures. I also use the same microbenchmark to measure the number of available rename registers on PRF microarchitectures, and show some special cases where certain instructions are handled without consuming physical rename registers.
Measuring Instruction Window Size
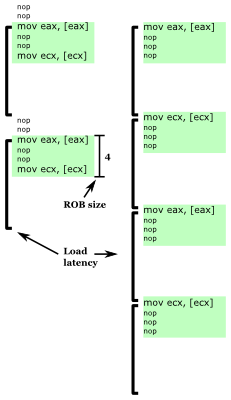
Fig. 1: Microbenchmark example showing two iterations of the microbenchmark inner loop for ROB size of 4 instructions, with three instructions per load (left) and four instructions per load (right). Loop latency nearly doubles when enough nops are inserted so that the next load does not fit in the ROB.
The instruction window constrains how many instructions ahead of the most recent unfinished instruction a processor can look at to find instructions to execute in parallel. Thus, I can create a microbenchmark that measures the size of the instruction window if it has these two characteristics: It uses a suitable long-latency instruction to block instruction commit, and it is able to observe how many instructions ahead the processor is able to execute once instruction commit is stalled.
A good long-latency instruction to use is a load that misses the cache. A typical cache miss latency is greater than 200 clock cycles, enough time to fill the reorder buffer with other instructions. One way to get a single load to consistently miss in the cache is to do pointer chasing in an appropriately-initialized array, like the method used to measure cache system behaviours.
The method I used to detect how far ahead of a cache miss a processor can examine is to place another cache miss some number of instructions after a first cache miss. When the first cache miss is blocking instruction commit, if the second cache miss is within the instruction window, then the two cache misses are overlapped (memory-level parallelism), but if it is outside the instruction window, the two memory accesses are serialized. NOP is a good filler instruction in between the memory loads because it executes quickly, has no data dependencies, and occupies a reorder buffer entry.
Figure 1 shows an example of the behaviour of two inner-loop iterations of this microbenchmark for a reorder buffer size of 4. When there are only three instructions per load (mov, nop, nop, mov, nop, nop, ...), the processor is able to search ahead to the next mov while stalled on the first, so that two cache misses can be partially overlapped, leading to executing one iteration of the loop for every cache miss time (plus a few nops). When enough nops are inserted so that the next cache miss cannot fit into the instruction window (mov, nop, nop, nop, mov, nop, nop, nop, ...), the two cache misses are serialized and one loop iteration takes nearly twice as long, executing one iteration in the time of two cache misses (plus a few nops).
Reorder Buffer Capacity
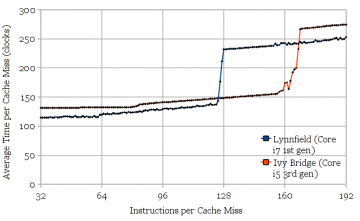
Figure 2 shows the results of using the microbenchmark to measure the reorder buffer size of Intel’s Ivy Bridge and Lynnfield (similar to Nehalem) microarchitectures. The measured values (168 and 128, respectively) agree with the published numbers. The stepwise increase in execution time caused by serializing the two cache misses is clearly visible in the graphs. The slight slope upwards reflects the execution throughput of NOPs.
Figure 3 shows results for other microarchitectures, with the curves cropped to the region of interest, for clarity. Again, the measurements agree with published numbers for all of the microarchitectures.
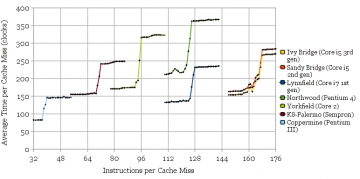
Fig 3: Reorder buffer capacities for several other microarchitectures: Ivy Bridge (168), Sandy Bridge (168), Lynnfield (128), Northwood (126), Yorkfield (96), Palermo (72), and Coppermine (40).
Hyper-Threading
On processors with Hyper-Threading, the reorder buffer is partitioned between two threads. It is known that this partitioning is static (and it makes sense to partition statically anyway), so each thread gets half of the ROB entries. One interesting question is whether this static partitioning occurs only when both thread contexts are active, or whether it’s permanently partitioned whenever Hyper-Threading is enabled.
Tests on Lynnfield (1st generation Core i7) and Northwood (Pentium 4) show that this partitioning occurs only when both thread contexts are active. Two copies of the microbenchmark pinned to two thread contexts on the same core shows half the ROB capacity when both thread contexts are active, but full capacity when one thread context is idle. Good.
Physical Register File Size
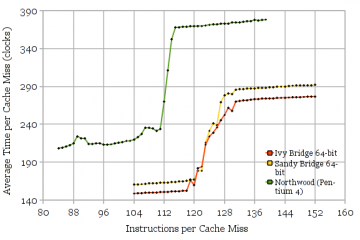
Fig. 4: Measuring the size of the speculative portion of the physical register file. Northwood (around 115), Sandy Bridge and Ivy Bridge (around 130-135).
Measuring the reorder buffer size uses nop instructions to separate the memory loads. This is ideal because nop instructions consume reorder buffer entries, but not destination registers. On microarchitectures that rename registers using a physical register file (PRF), there are often fewer registers than reorder buffer entries (because some instructions don’t produce a register result, such as branches). If the filler instruction is changed from nop to one that produces a register result (ADD), I can measure the size of the speculative portion of the PRF.
Note that since the PRF holds both speculative and committed register values, I cannot measure the size of the entire PRF, only the portion holding speculative values. However, if we assume that published PRF sizes are correct, the difference would indicate the number of registers used for architectural state, which includes both x86 ISA-visible state as well as some extra architectural registers for internal use.
Figure 4 shows the results for microarchitectures that use a physical register file. The Pentium 4 Northwood appears to have 115 speculative PRF entries. Since the PRF size is expected to be 128 entries, that means 13 registers are used for non-speculative state. Sandy Bridge and Ivy Bridge appear to have 131. The noisy region between 118 and 131 registers hints at some non-ideal behaviour in reclaiming unused registers (in exchange for simpler hardware?), resulting in fewer registers being available for use some but not all of the time. Assuming the expected 160-entry PRF leaves 29 registers of non-speculative state. This seems somewhat high even considering that SNB/IVB are 64-bit (16 architectural integer registers) and Northwood is 32-bit (8 architectural integer registers).
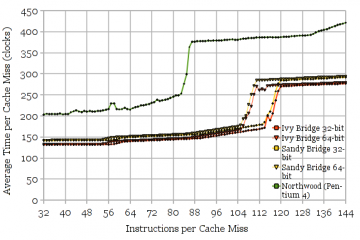
Fig. 5: FP/SSE Physical Register File Size. Sandy Bridge and Ivy Bridge have 120 available speculative entries (32-bit mode). Northwood has 87.
The same experiment (Figure 5) can be repeated with a 128-bit SSE (or 256-bit AVX) instruction to measure the size of the floating-point and SSE PRF. As before, there are more registers used for non-speculative state than expected. Sandy Bridge and Ivy Bridge should have 144 registers (120 available for speculative state), and Northwood should have 128 registers (87 available for speculative state). Interestingly, there are 9 fewer speculative registers (111 vs. 120) in 64-bit mode than 32-bit, probably for YMM8-15 that are inaccessible in 32-bit mode. I can’t explain why so many registers are needed for non-speculative state (24 to 41), since the ISA-visible state mainly consists of 8 x87 floating-point registers, and 8 or 16 XMM or YMM registers.
x86 Zeroing Idiom and MOV Optimization
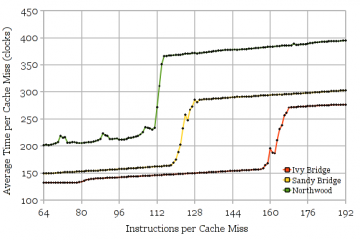
Fig. 6a: Ivy Bridge executes MOV instructions without consuming destination registers (limited by 168-entry ROB), while Sandy Bridge and Northwood do (limited by speculative portion of PRF).
A common x86 idiom for zeroing registers is to XOR a register with itself. Processors usually recognize this sequence and break the dependence on the source register value. In PRF microarchitectures, it may be possible to optimize this even further and point the renamer entry for that register to a special “zero” register, or augment the renamer with a special value indicating the register holds a value of zero, and not require any execution resources for the instruction. I can test for the zeroing idiom by repeating the above test using XOR reg, reg instructions and observing whether those instructions consume destination registers. Both Sandy Bridge and Ivy Bridge can zero registers without consuming destination registers, while Northwood does consume destination registers. (Graphs not shown)
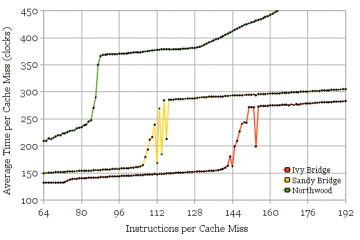
Fig. 6b: Ivy Bridge MOV optimization for 256-bit MOVDQA instructions (128-bit MOVDQA for Northwood). Fewer registers are used, but there is something other than the ROB size that limits the instruction window.
I can measure some other microarchitecture features by changing the instruction used, similar to the previous section.
Repeating the test with MOV instructions can show whether register to register moves are executed by manipulating pointers in the register renamer rather than copying values. This is a known new feature in Ivy Bridge. Figure 6 shows that it is indeed new in Ivy Bridge. Oddly, when the source and destination registers are the same, this optimization does not happen, nor is the operation treated as a NOP. Figure 6b shows the results for using 256-bit AVX MOVDQA. These look strange. It is also strange that Ivy Bridge’s instruction window is lower than the ROB size of 168 entries, as though registers were still consumed, though fewer.
Unresolved Puzzle
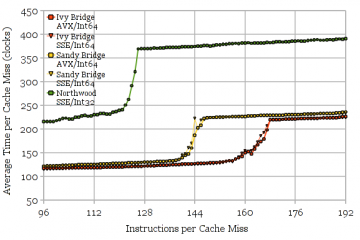
Fig. 7: Sandy Bridge executing interleaved 256-bit AVX and 64-bit addition instructions is limited to a 147-instruction window, which is greater than both PRFs, but smaller than the ROB
We know that in both Sandy/Ivy Bridge and Northwood, there are separate floating-point/SSE/AVX and integer register files. If I use instructions that do not produce a destination register (nop), the instruction window is limited by the ROB size. Similarly, if I use instructions that produce an integer or AVX/SSE result, the instruction windows becomes limited by the integer or FP/SSE register file instead. If I alternate between integer and SSE/AVX instructions, I would expect that the instruction window becomes ROB-size limited again, since the demand for registers is spread across two register files.
Figure 7 shows the results of this experiment. Ivy Bridge and Northwood behave as expected: AVX or SSE interleaved with an integer addition are limited by the ROB size. Sandy Bridge AVX or SSE interleaved with integer instructions seems to be limited to looking ahead ~147 instructions by something other than the ROB. Having tried other combinations (e.g., varying the ordering and proportion of AVX vs. integer instructions, inserting some NOPs into the mix), it seems as though both SSE/AVX and integer instructions consume registers from some form of shared pool, as the instruction window is always limited to around 147 regardless of how many of each type of instruction are used, as long as neither type exhausts its own PRF supply on its own. That is, when AVX instructions < ~110 and integer instructions < ~130, the instruction window becomes limited to ~147, regardless of how many of each type are in the instruction window. I can’t think of any reason why SSE/AVX and integer register allocations should be linked. This strange behaviour appears to be fixed in Ivy Bridge, but Figure 6b shows Ivy Bridge still has some strangeness in its AVX register allocation…
Conclusion
Using two chains of pointer chasing with filler instructions is a powerful tool to find out certain details about a processor’s microarchitecture. I’ve shown how to use it to measure the reorder buffer size, the number of available speculative registers in physical register files, and measure the existence of several related optimizations. This is not an exhaustive list, but I need to get back to doing real work now…
Code
Caution: Not well documented.
Cite
- H. Wong, Measuring Reorder Buffer Capacity, May, 2013. [Online]. Available: https://blog.stuffedcow.net/2013/05/measuring-rob-capacity/
[Bibtex]@misc{measuring-rob, author={Henry Wong}, title={Measuring Reorder Buffer Capacity}, month={may}, year=2013, url={https://blog.stuffedcow.net/2013/05/measuring-rob-capacity/} }
I forget: Does Sandy Bridge separate the issue queue/reservation station from the reorder buffer? I wonder if that has anything to do with the limit of 147.
I think pretty much all modern processors separate the ROB from schedulers, as the scheduler tends to be smaller. Sandy Bridge and Ivy Bridge are supposed to have 54-entry scheduler entries. I don’t see what impact that would have though, as this microbenchmark should keep the schedulers nearly empty.
hi henry,
I have read the robsize.cc and the asm code it generate by make_routine(), but there are some place that I can’t understand.
the asm code in the ibuf before loop_start insert some nops:
at begining, it has 8 nops, I don’t understand the purpose of these nops;
does the nops before loop_start was to make the loop_start align to a 16B boundry(in “while (((unsigned long long)ibuf+pbuf) & 0xf) ADD_BYTE(0x90);”)?
and what’s the function of many “sub reg 0”?
at last, in the loop “for (int u=unroll-1; u>=0; u–)”,the last inter loop:
for (int j=0;j<icount-1-16 -((u==0 && !is_xmm[instr]) ? 1 : 0);j++,i++)
{
pbuf += add_filler(ibuf+pbuf, instr, j);
}
why use (u==0 && !is_xmm[instr]) ? 1 : 0), I find it generate different times of instr for normal instr and sse instr:
when the icount is 32, this loop gnerate 14 normal instr ,but 15 sse instr. why the number of instr need different?
Thanks!
I hope I have express it clearly because my English is poor. 🙂
Hi, sorry for the slow reply.
The purpose of the 8 NOPs (16 bytes) at the beginning of the routine is a “NOP slide” to allow the start address of the routine to be randomized (See
void(*routine_skip)() = routine + (i%13);on Line 308). Branching to any of the first 16 bytes gets the same functionality. I forget why I wanted to jump to a different address every time the routine is called though. It may have been strange performance that depended on it.The purpose of the “sub reg, 0” is to make the architectural registers consume a physical register (although perhaps 0 isn’t a good constant to use in case it can be detected as a NOP). On microarchitectures with reference counting (e.g., Ivy Bridge), zeroing (or even copying) the architectural registers results in all of the architectural registers pointing to the same physical register, which reduces the number of physical registers used. Older renaming schemes allowed at most one architectural register to point to a physical register.
The inner loop created by make_routine is somewhat specialized for measuring the number of physical registers consumed. There is one fewer instruction generated for regular integer operations because there is a sub eax, 1 used for the loop counter that also consumes an integer register (but does not consume a XMM register when measuring XMM register use). I wanted the inner loop body to contain exactly the right number of registers (integer or XMM) consumed. (Hmm… it looks like I might have not compensated for the memory operation when measuring XMM register use).
I have been trying to understand hardware partitioning due to HyperThreading in the Intel Haswell core, but I am still mostly in the “confused” stage.
On a Xeon E5-2670 v3 with HyperThreading enabled, your code showed the same pattern that you saw on the Lynnfield and Northwood cores — with one thread running the results were consistent with 192 ROB entries, while with two threads pinned to the same physical core, the results were consistent with an even split of ROB entries between the two threads. This is good news for performance, though it raises a fair number of questions about implementation. Most importantly, if one logical processor is using all 192 ROB entries and the sibling logical processor “wakes up” to run a thread, how does the hardware reclaim the 96 entries for the newly awakened logical processor?
Hmmmm…. I suppose that there is usually plenty of time to do this — the file /sys/devices/system/cpu/cpu0/cpuidle/state1/latency says that it takes 2 microseconds for a logical processor to “wake up” from C1 state, so the hardware could use that period to allow the entries in the (now-reserved) half of the ROB to drain without allowing the currently running logical processor to make any new allocations that half of the ROB. By the time the OS is allowed to perform an interprocessor interrupt to schedule a process on the newly-awakened logical processor, there should be plenty of ROB entries to use without needing to interrupt the currently running logical processor to modify the partitioning. This would be tricky to measure, but it is mostly of academic interest — I don’t think that this could happen often enough to make a significant difference to performance….
Hello!
I have no inside information, but I would expect switching from 1 to 2 threads (and back) would require a pipeline flush. At least, it’s not particularly expensive (few tens of clocks) relative to how often it occurs, and makes things simpler than inventing an online method of switching between modes for every affected hardware resource.
For the ROB, I expect the ROB to be a circular queue rather than a shifting/compacting queue (for power reasons), so [waiting for half the ROB to drain] is not quite sufficient to partition the ROB into two.
Wake up: Hmm… I thought x86’s way of putting a processor to sleep is the HLT instruction (halt until an interrupt). So a slow wakeup would appear as a high (inter-processor?) interrupt latency.
I suspect it might be possible to measure whether repeatedly waking/sleeping one thread has any impact on the other thread (in the form of pipeline flushes)…
Does the functioning of the ROB and PRF imply anything about code generation? I mean evidently you want to organize your code to maximize ILP and MLP, so there are somewhat obvious takeaways such as grouping memory operations which have MLP (so they are more likely to be submitted at once, rather than being blocked by ROB or scheduler window limits (the same effect this benchmarks measures) – but what I’m interested in specifically register use.
Especially when writing 3-arg code (AVX) you often you can choose to use more registers, or fewer for otherwise equivalent code. The choice seems arbitrary when you aren’t under register pressure, and when writing by hand sometimes using more is easier since it means less tracking of value lifetimes and a bit more flexibility to re-order statements. Based on the limited number of physical registers, however, it seems that it may be better to try to more frequently use a smaller pool of arhictectural registers? That is, more overwrites of a register when its value is dead.
I mean the difference between the following code to add the bytes in 4 32-byte vectors:
vzeroall
; add first pair
vmovdqa ymm1, [rdi]
vpaddb ymm2, ymm1, [rdi + 32]
; second pair
vmovdqa ymm3, [rdi]
vpaddb ymm4, ymm3,[rdi + 64]
; final result
vpaddb ymm5, ymm2, ymm3
versus:
vzeroall
; add first pair
vmovdqa ymm1, [rdi]
vpaddb ymm1, ymm1, [rdi + 32]
; second pair
vmovdqa ymm2, [rdi]
vpaddb ymm2, ymm2,[rdi + 64]
; final result
vpaddb ymm1, ymm1, ymm2
These are (barring typos), semantically equivalent, and seem more or less equivalent from an ILP and re-ordering point of view. The former uses 5 distinct arch registers, however, while the latter uses only 2. It occurs to me that the latter might use fewer PRF entries, since at least at the end of the former sequence all of ymm1 – ymm5 are live.
I guess it depends on the initial state – if ymm3 – ymm5 were already live on entry, maybe it doesn’t matter, since overwriting them then doesn’t change the number of PRF entries used. That’s why I shoved a vzeroall in there: to ensure that all arch regs initially point to the zero register.
I think you’re correct that under some conditions, using fewer architectural registers would result in fewer physical registers being used. But my guess is that this effect is too small to be worth worrying about. It seems rare you’d actually be limited by PRF register pressure, and even if you are, the performance impact is still small.
This would only apply to PRF architectures where clearing registers actually causes the physical register to be freed (as opposed to having one allocated holding a zero). From the point of view of the processor, every architectural register is live except those that have been explicitly cleared (e.g., vzeroall might do it). This implies that to see any performance effect, the code must clear architectural registers and then not use them for at least many hundreds of instructions.
Suppose the above requirement is satisfied, how many more in-flight instructions could you get by reducing architectural register use? At most 15 and typically much fewer (there are 16 registers, so at best, an algorithm that used 16 architectural registers now uses just 1). If the code is limited by PRF size, that’s a gain of ~a few percent of in-flight instructions (which usually translates to much less than that in IPC). You’d also need somewhat unusual code to use so many destination registers that it’s limited by ~130 speculative PRF entries (out of 160 total) but not the 168-entry ROB or the limit of ~10 in-flight cache misses. It seems unlikely that real code would have so few compare, branch, non-AVX/SSE, stores, etc. that the PRF is exhausted before the ROB.
That said, I don’t see any harm to using fewer architectural registers, unless the code becomes less efficient as a result.
Thanks Henry, for your comprehensive answer.
One more while I’m here: you imply above that you tested both SSE (xmm) and AVX (ymm) regs when testing the size of the FP/SIMD register file, but can you confirm explicitly that you tested AVX registers and that there were as many as SSE? I have seen a claim that there are only half the number of 256-bit (ymm) regs, since 2 entries are used for a full-width reg, but your test could help show that isn’t true.
I certainly did test both SSE and AVX (It’s in the code as instruction types 8-19), but only with movdqa, movaps, xorps, and vxorps. I don’t remember what I reported for Fig. 5, but I likely would have noted something if the SSE vs. AVX numbers were vastly different.
Fig. 6b is measured using 256-bit (AVX) movdqa, and there are ~112 speculative registers observed there. Unless something special happens formovdqa, it seems pretty certain that the PRF isn’t halved for AVX registers (Expected committed+speculative entries is 144).
Of course, this only applies to SNB/IVB microarchitectures. I think some of the AMD processors use a 128-bit AVX unit, so it’s plausible those use a different implementation.
Thanks Henry.
I ran your code on Skylake, and put some of the results in this thread (where we are discussing your benchmark, feel free to jump in):
http://www.realworldtech.com/forum/?threadid=166772&curpostid=167685
Some notes:
In Skylake, there are almost exactly the expected number of speculative registers available (measured 150, versus expected of 168 regs – 16 committed = 152). Haswell still has the big gap (per tests on the thread). I suppose that the “missing” registers are 16 regs used to save the upper dirty state of ymm regs when non-VEX code is encountered with dirty ymm regs (i.e., vzeroupper/all wasn’t used). That about exactly explains the missing regs: you reported 41 non-speculative regs in 64-bit mode, which could be 16 (arch regs) + 8 (FP regs) + 16 (saved dirty) = 40.
In Skylake, the mixed VEX/non-VEX behavior changed dramatically: rather than incur a one-time transition cost to store away the upper parts when non-VEX follows VEX (and another transition cost restore them in the reverse scenario), Skylake simply runs non-VEX code with dirty upper regs in a much slower mode that constantly merges the lower 128-bit result of every SSE op with with the unchanged upper bits. Perhaps you are already aware, but here’s a summary if not: http://stackoverflow.com/a/41349852/149138
… so the number of available regs SIMD regs in the PRF suddenly jumping up makes sense in light of that change (no storage is needed for the upper bits). It also goes a long way to explaining why Intel would make that change, which seems like it is often much worse[1]: because they recovered 16 usable regs in the SIMD file. Note also they bumped up the integer PRF in Skylake (168 -> 180) but not the AVX one (perhaps because they already got a similar bump by recovering the regs).
[1] – the new behavior seems much worse in practice: rather than a one-time transition cost, you pay an ongoing cost (often 2x – 10x slower!) forever. The main problem is the Haswell behavior only penalized code that actively mixes VEX and non-VEX code, which is kind of a hard mistake to make in any tight kernel, unless you are calling out to unknown code which does it (but such calls are often slow so the transition cost might not be so terrible). In Skylake, even in a single call anywhere in your non-VEX code that dirties the regs causes your app to be slow forever (and the calls to “fix it” like vzeroupper aren’t even part of SSE, so SSE-only code may have trouble calling). Code that was once fast is now broken by a couple of VEX-encoding instructions in the dynamic linker for example (real case that has bitten many apps). Bleh.
I have used your nice program to measure the ROB size of various machines in our collection (13 conclusive results with partial overlap of the results here). You can find the results here.
The Bobcat does not exhibit the step in the results that the others exhibit (I reduced the starting instruction count to 3, but did not see such a step in that range, either). Apparently one of the assumptions used in the measurement program does not hold for Bobcat.
I considered modifying the program to also measure ARM and PowerPC CPUs, but looking at the program, it’s not a straightforward task, so I refrained from doing it. I also did not measure the rename registers, because it is not obvious how to do it.
About the Bobcat result: My current theory is that it does not support two simultaneous main memory accesses. I tried to confirm this my replacing the second load with a div instruction (which should also have a long latency; in divided 0xfffffffffffffffe:0xffffffffffffffff by 0xffffffffffffffff (which conveniently puts the same values in the registers that were there before). Unfortunately, I did not see the step in the results, but I did see that the times are much lower than with two loads (172 cycles instead of 262), supporting the theory that the Bobcat does not support two simultaneous main memory accesses (at least not in every part of the memory access).
The good thing with Bobcat is that there is a known answer (56 entries, https://www.computer.org/csdl/magazine/mi/2011/02/mmi2011020016/13rRUwd9CCK).
Without trying it, my guess is that Bobcat supports multiple in-flight cache mises. Even in-order CPUs did this, so I think it’s unlikely to have been removed. The way I’d test for it is to change the two parallel pointer chases into a single dependent chain (~same instructions, just a change in dataflow): If the loads were overlapped, latency would get worse if you serialized them. Looking at your data, 270ish cycles sounds more like a bit over 1 memory latency rather than 2 (i.e., the two memory accesses are at least somewhat overlapped).
My guess would be that Bobcat decodes nops at a rate of 2/cycle, then discards nops so they don’t occupy ROB space.
I found another interesting violation of one of the assumptions of the microbenchmark recently (that pointer chasing causes cache misses). The Apple A12 (Vortex big core) has a prefetcher that can follow pointer chasing…
This seems like a relevant patent:
https://patents.google.com/patent/US20140095838A1
Starting around [0026] it describes physical register reclamation, which is complicated by register sharing due to move elimination, and memory renaming (which seems to have appeared in ICL). In particular, it indicates that reclamation might take several cycles, which could be why some of the transitions are not “sharp” i.e., going from the low value to a high value over a single cycle, or at least the start of the elbow where they start to curve up: when there is only say one entry left in the PRF (i.e., the instruction count in your test is 167 and there are 168 regs), there is a several cycle loop between when a register gets allocated for an instruction, the instruction gets executed, and the register gets freed, allowing the next instruction to get allocated. So throughput might drop from say 3/cycle (for independent vpxor or add or whatever) to 1 per 4 cycles or something like that.
It also mentions boundary cases which might cause some of the larger spiky behavior at the transition point.
Finally, the PRRT (physical register reclaim table), I think, is a candidate for this “shared resource” which prevents the mixed GP/vector case from getting to the full ROB size (the “Unsolved mystery” part of your post). It seems like this would be a per-instruction table, and so inherently shared between GP and vector ops – and maybe this wasn’t sized as big as the ROB in Sandy Bridge. The performance counter description for the RESOURCE_STALLS2.ANY event used to include this text:
The even covers 5 different umask bits (hence 5 distinct events, but we can eliminate 3 since they are mentioned as finer-grained events. Of the remaining two bits, I observed large counts (roughly equal to the total stall cycles) for one of them exactly for your mixed tests, but not for other tests. This doesn’t show that it’s the PRRT necessarily, because the list in the quote might not be exhaustive, but we can at least eliminate most of the other causes since they are covered by other events or don’t make sense (e.g,. the test doesn’t have many branches, which I think eliminates PHT and BOB).
Hi Henry
I have two problems. one of them is about the code. I ran this code in linux because I don’t know why didn’t run in windows os anyway when I ran this code in linux but I saw an error in line 12 because of the Boolean variable did not run I feel it was wrongly set because as far as I know the Boolean variable has two values, True and False, but in this code it was wrong.
Another my problem is how can I measure the capacity of the reorder buffer of the CPU of my computer.
please please please help me especially the second case.
Hi Danial,
Yes, the code was written for Linux. It should be reasonably straightforward to port to Windows if you wanted to. I think the only unusual thing is how the program writes out x86 machine code into memory and then executes it, which requires getting execute permission on the page of code. On Windows, that’s probably done using the VirtualProtect Windows API function instead of mprotect. You could also simplify the code if you don’t need the ability to try 26 different filler instructions.
I don’t know what you mean by “how can I measure the capacity of the reorder buffer”… That’s already explained in the section “Measuring Instruction Window Size”, no?
Hi Henry
Can I have your email?
Because my teacher gave me a project, if you have time, I will send it to you. Take a look and guide me if it is possible.
thank you
Me email is listed on my contact page: https://www.stuffedcow.net/contact
I’m not sure how much help I can be, because there’s already sample code here and an explanation of the theory. I assume you already know how to write assembly code or inline assembly in C and measure how long it takes to run.
Hello Mr. Travis
I ran the code for the robsize.cc file in Linux, but unfortunately it does not run, and line 12 gives the Boolean variable type error.
What do you think I should do?
How can I fix this error?
With this file I want to analyze the buffer size (ROB) on my laptop
Please help and assist if possible
Thanks
I don’t know if I’m looking at the same file, but line 12 is “#include <sys/mman.h>”, and I don’t see “Boolean” anywhere in the file.
Hi Henry
Yes, that’s right.
I got it wrong, I mean finding the library in Linux
Can you explain how to add it?
If you’re missing sys/mman.h, that’s part of the glibc headers. Depending on your Linux distribution, that might be the libc6-dev or glibc-devel package. But typically, if you have a C compiler installed, the glibc headers would already have been installed.
Hello Henry
I have read the code robsize.cc and I am confused with dbuf.Althrough with your content above, I don’t understand what does dbuf do.
Sorry for the question I asked just now, I have understood the function of dbuf. But I got another problem about the code: what is the purpose of these subtraction
instructions part of robsize.cc.
ADD_DWORD(0x00e88348 | (3<<16)); // sub ebx, 0
ADD_DWORD(0x00e88348 | (5<<16)); // sub ebp, 0
ADD_DWORD(0x00e88348 | (6<<16)); // sub esi, 0
ADD_DWORD(0x00e88348 | (7<<16)); // sub edi, 0
ADD_DWORD(0x00e88349 | (0<<16)); // sub r8, 0
ADD_DWORD(0x00e88349 | (1<<16)); // sub r9, 0
ADD_DWORD(0x00e88349 | (2<<16)); // sub r10, 0
ADD_DWORD(0x00e88349 | (3<<16)); // sub r11, 0
ADD_DWORD(0x00e88349 | (4<<16)); // sub r12, 0
ADD_DWORD(0x00e88349 | (5<<16)); // sub r13, 0
ADD_DWORD(0x00e88349 | (6<<16)); // sub r14, 0
ADD_DWORD(0x00e88349 | (7<<16)); // sub r15, 0
Hello. Glad you figured it out. In case someone else is wondering, dbuf is a big array of pointers initialized so that dereferencing it gets a cache miss.
I don’t really remember what the subtractions are for. It looks like I was attempting to ensure that every logical register maps to its own physical register, to make the physical register file measurements more consistent. (I don’t touch rax, rcx, rdx, and rsp because those are already used in the routine). With move elimination, it is possible for multiple logical registers to share a single physical register. Writing a value into each logical register is intended to ensure physical registers aren’t shared. (In retrospect, subtracting a constant is too easy for modern processors to optimize away.)
Rencently I’m reading another paper SQUIP: Exploiting the Scheduler Queue Contention Side Channel, do you think the scheduler queue mentioned in this paper is another name of reorder buffer in your blog?
The reorder buffer (ROB) is not the scheduler queue. The ROB holds all instructions that have not yet retired, in program order. This includes instructions that have already executed.
The scheduler queue (also called a “scheduler”, or “reservation stations”) only holds instructions that have not yet executed, and are waiting for their source operands to become ready. The scheduler is not in program order. (Instructions enter the scheduler in program order, but they are removed out-of-order, when an instruction’s operands become ready and the instruction has executed.)
My doubt why they go for odd numbers for rob entry not the 2^ entries means some has 448 like